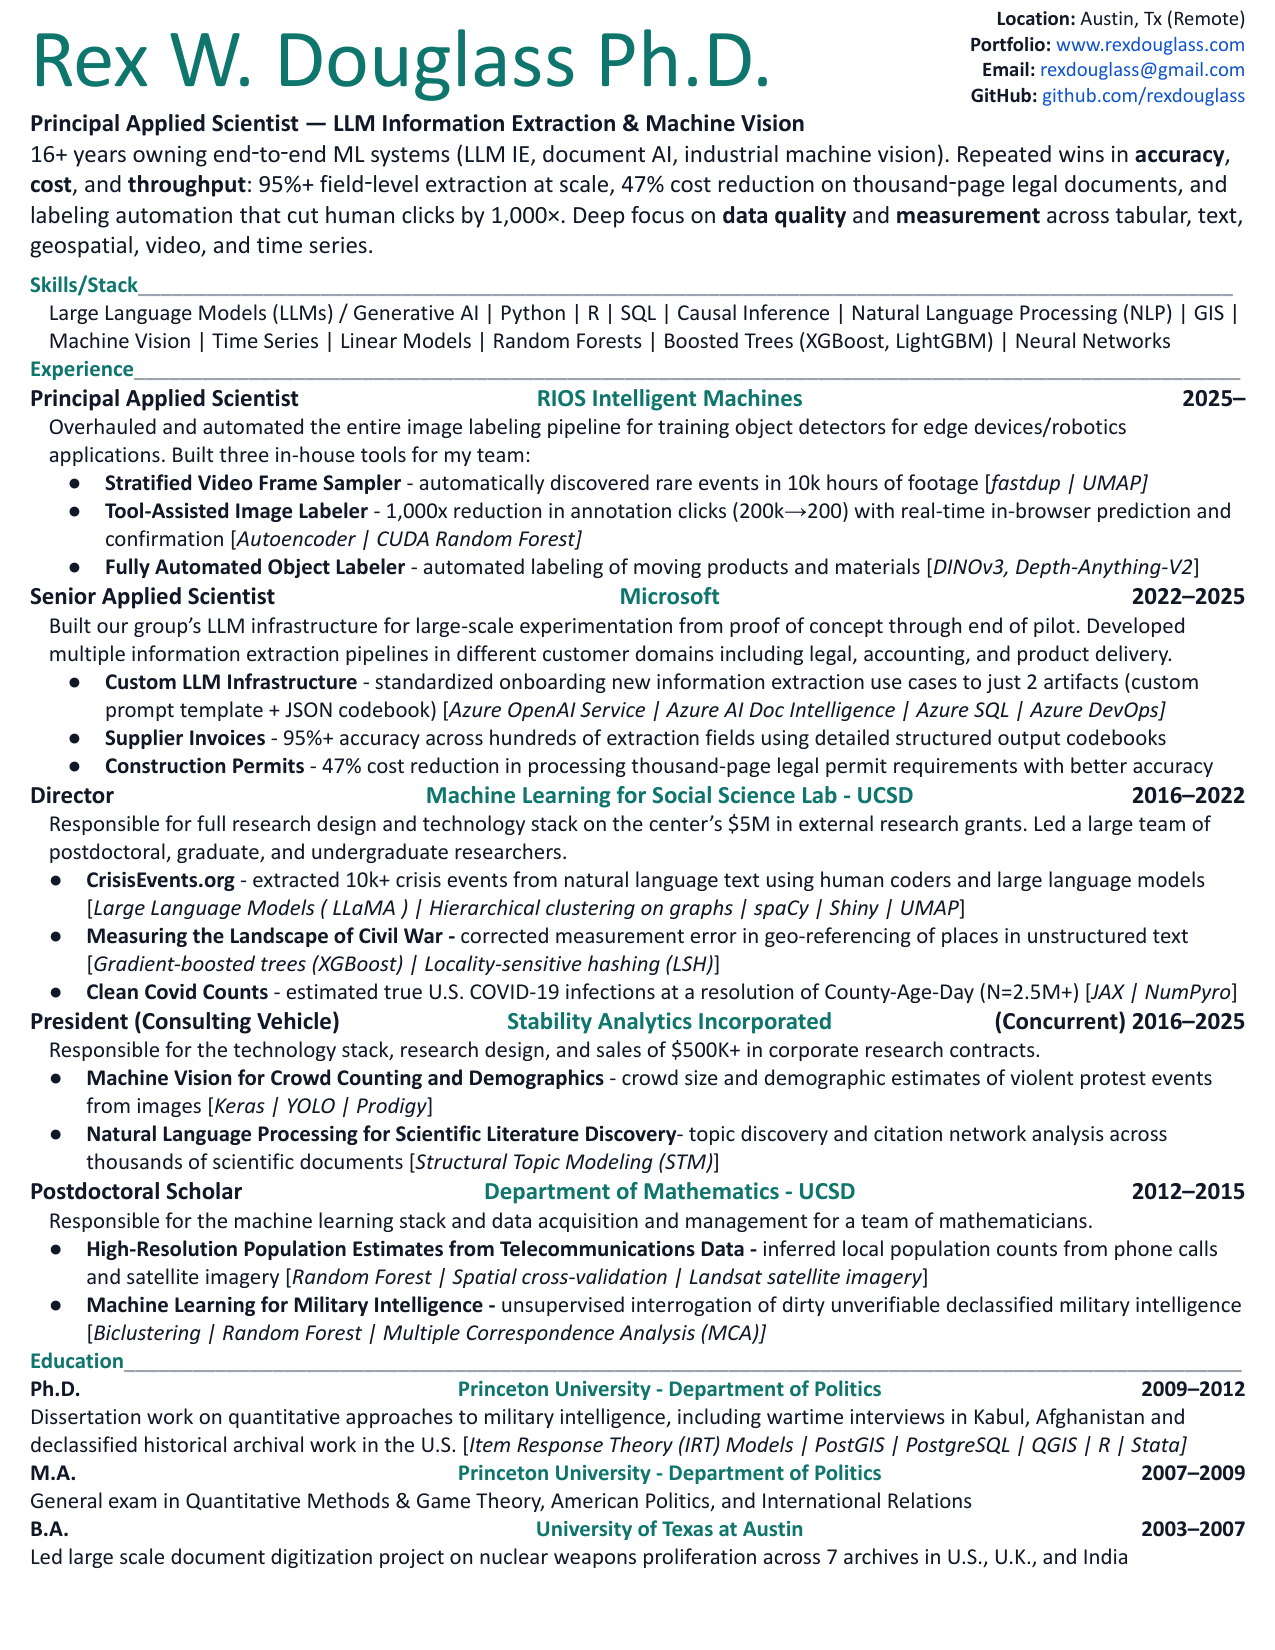
16+ years owning end‑to‑end ML systems (LLM IE, document AI, industrial machine vision). Repeated wins in accuracy, cost, and throughput. Deep focus on data quality and measurement across tabular, text, geospatial, video, and time series.


1. Auto-Labeling Industrial Videos
Result: Completely unsupervised segmentation and labeling of parts, tools, and people in manufacturing settings.
Method: (1) LLM drafts the scene narrative; (2) LLM proposes label vocabularies; (3) Grounding DINO supplies bounding boxes; (4) LLM filters boxes; (5) SAM2 propagates high-confidence masklets; (6) distilled YOLO runs at the edge. Definitions (scene, frame, object instance, masklet) standardize the units.
Stack: DINO · SAM-2 · Gemini · YOLO.
2. Foreground Detection at Scale
Result: Unsupervised segmentation of manufactured foreground objects.
Method: (1) Stabalize video (2) compute depth and semantic embeddings (3) cluster patches (4) track relative movement of cluster centroids and depth (5) foreground objects both move and dominate background objects
Stack: DINO-V3, Depth-Anything-V2, YOLO
Resources: Developed for RIOS Intelligent Machines
3. Stratified Video Frame Sampler
Result: Unsupervised stratified sample of rare events hidden in millions of frames tens of thousands of hours of video.
Method: (1) Pull key-frames from 15 second clips (2) sample on statistics available from H.264, oversampling rare quantiles (3) semanticly embed and cluster with fastdup (4) choose representative frames from each cluster (5) visualize original clips with UMAP.
Stack: fastdup · UMAP
Resources: Developed for RIOS Intelligent Machines
4. Tool-Assisted Labeling
Result: Reduced anntator-clicks required by 1000x.
Method: (1) Custom graphical-user-interface (2) precompute pixel level features (3) GPU based random forest updates training and prediction within seconds for realtime feedback
Stack: Custom Autoencoder, DINO-V3, Depth-Anything-V2, GPU Random Forest
Resources: Developed for RIOS Intelligent Machines
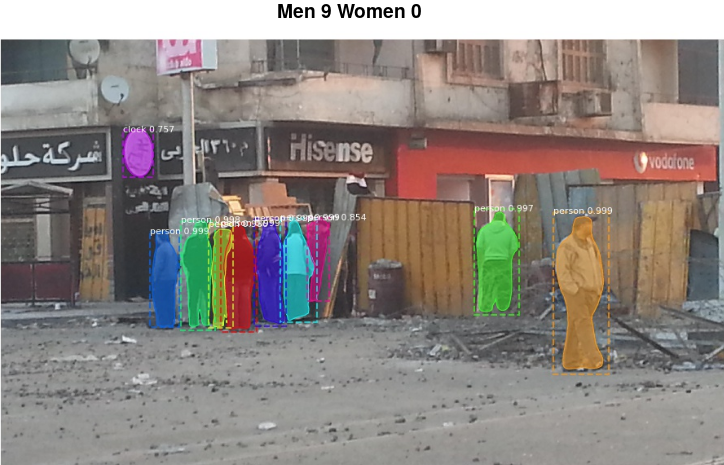
5. Crowd Counting in Imagery

Result: Crowd size and demographics estimate for protest imagery.
Method: (1) Collect a massive stratified corpus of imagery with diverse ethnicities, ages, and time periods (2) detect and extract people identified in image (3) normalize extracted persons by using average height to width ratios of humans (4) handle occlusion by masking pixels not seen in the normalized bounding box (5) hand label demographics of 10k extracted persons (6) custom classifier to assign demographics to extracted persons.
Stack: Yolo, Keras, Prodigy
Resources: Developed for a project at the University of Denver
6. Machine Vision for Military Maps
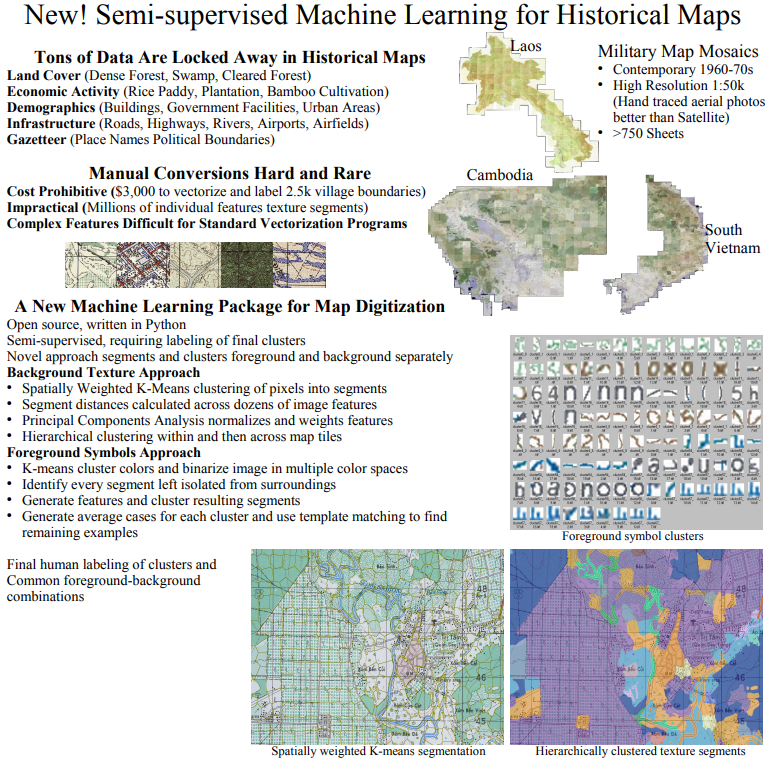
Result: Unsupervised extraction of remote-sensing data from printed military maps spanning the 1920s-1970s prior to modern satellite mapping.
Method: (1) spatially weighted k-means segmentation (2) hiearchical clustering
Stack: OpenCV, Keras
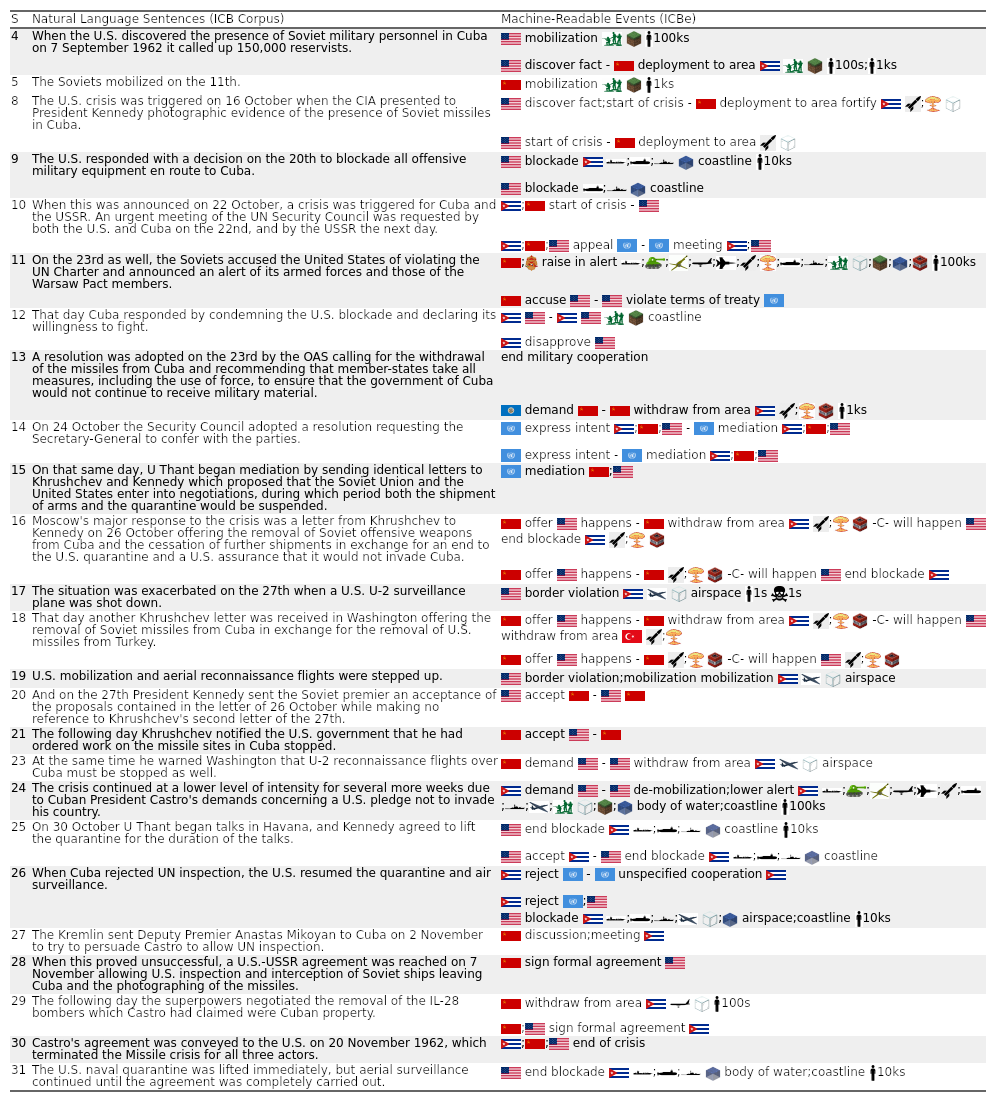
7. Narrative Events & Visualizations

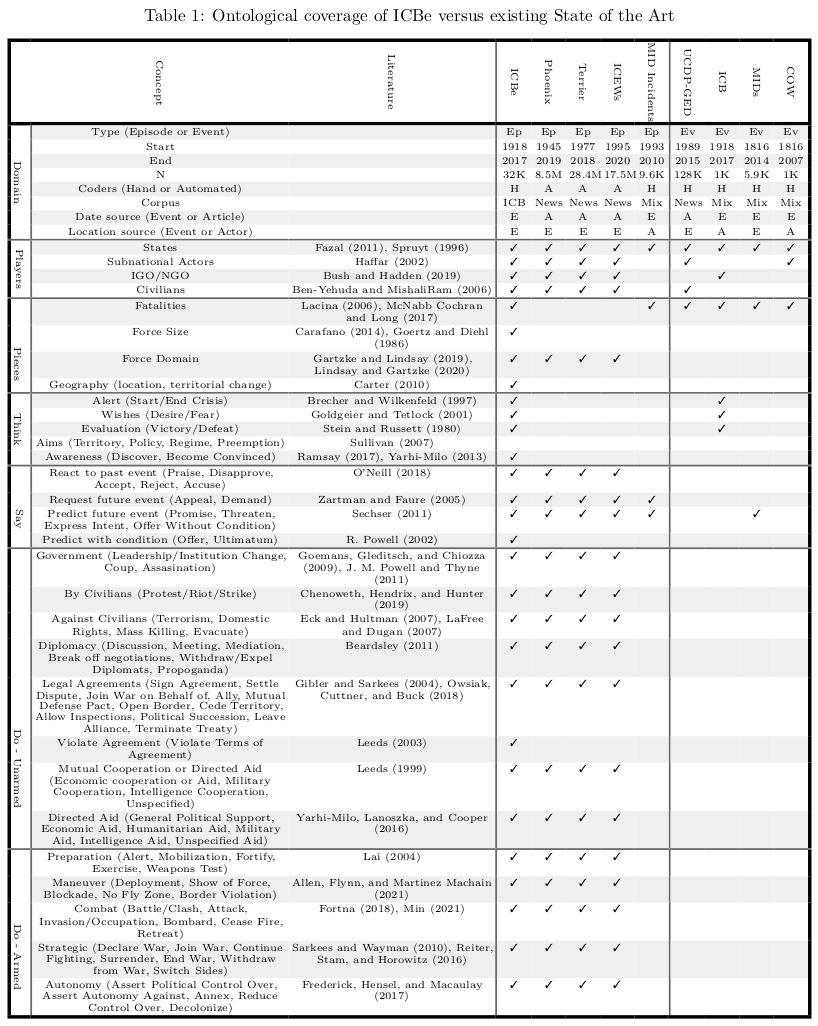
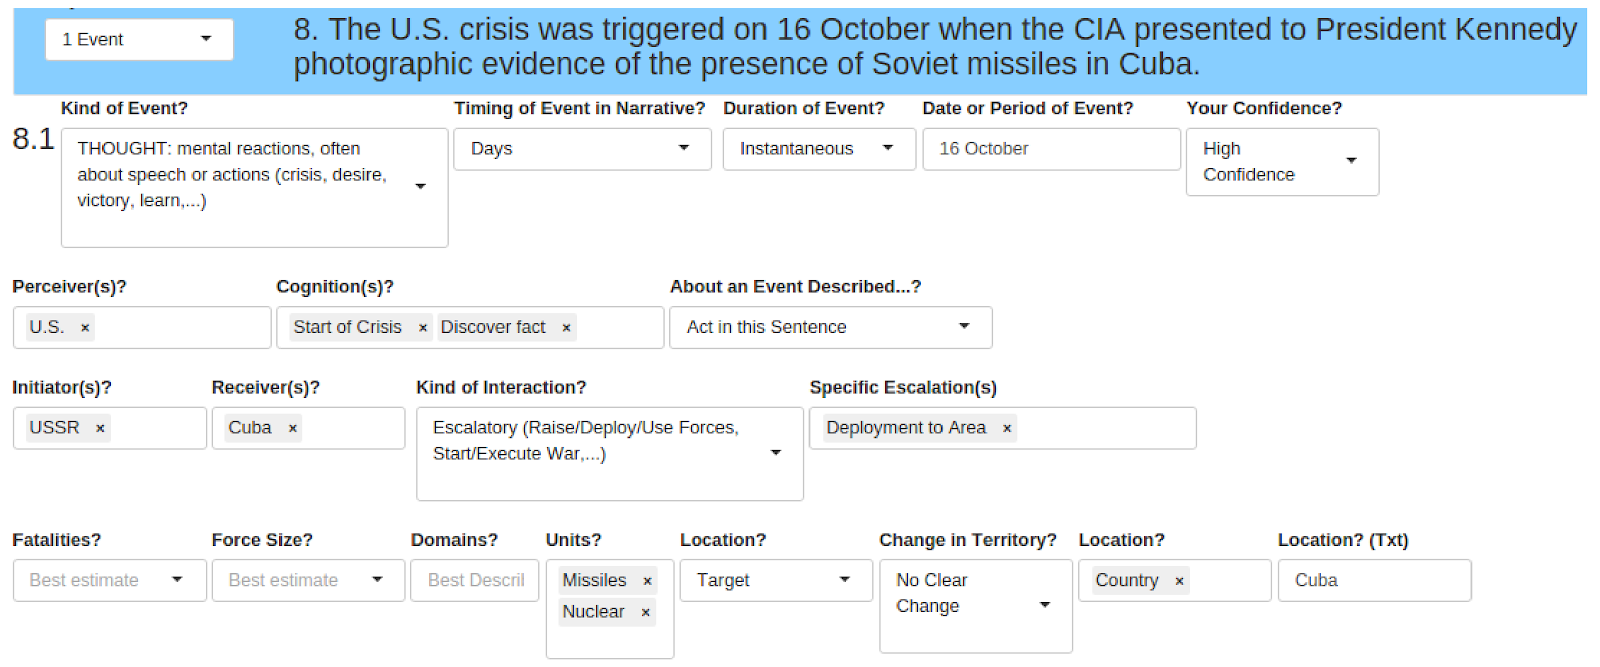
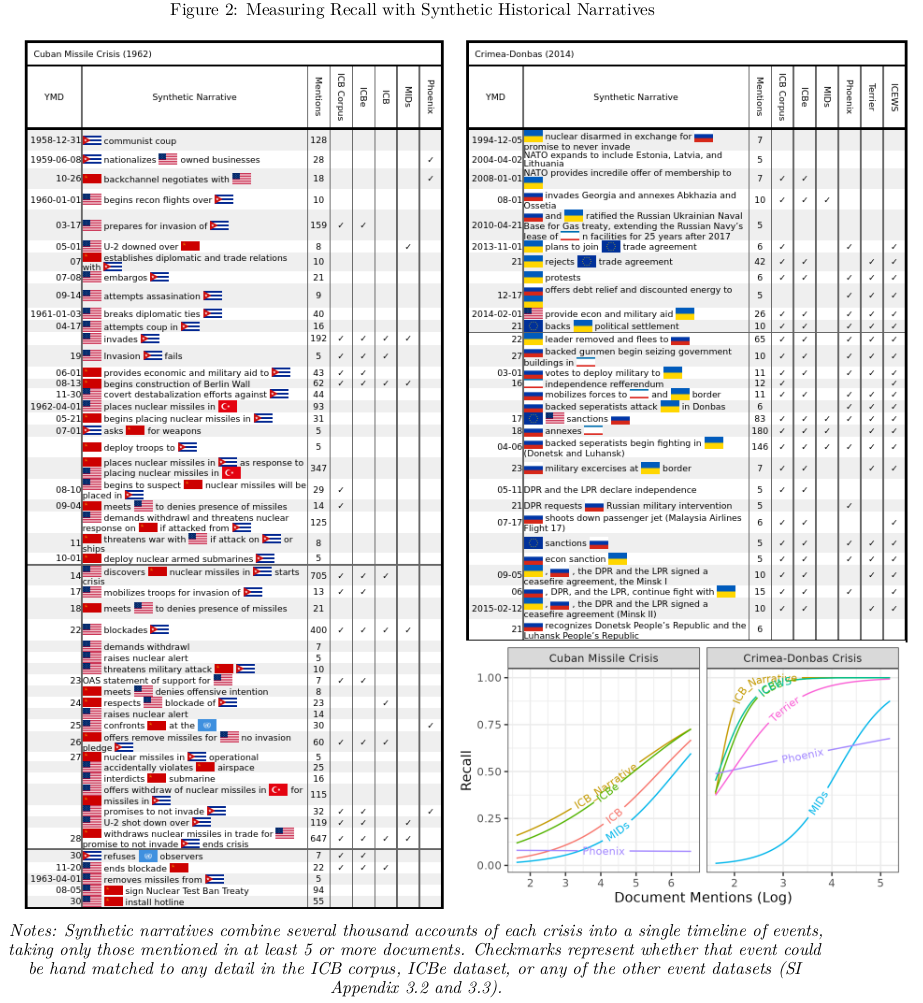
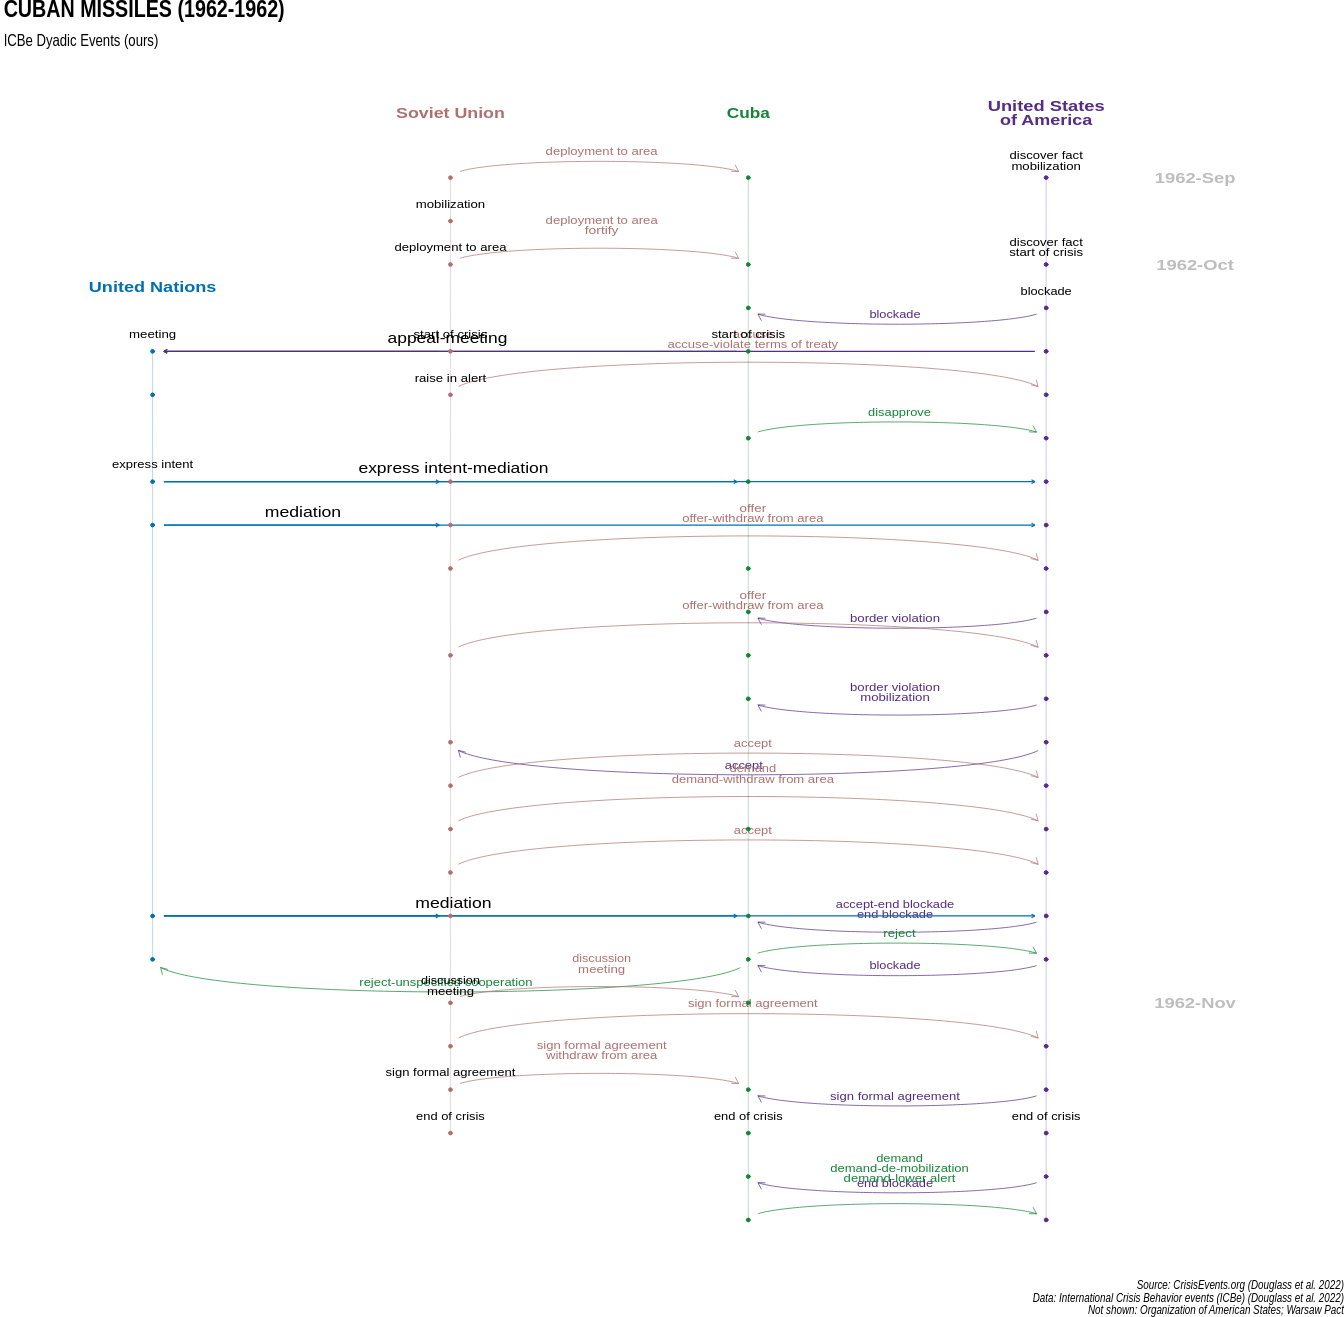
Result: We introduce the first high coverage, high recall, AND high precision international conflict database. International Crisis Behaviors Events (ICBe) is a human coded event dataset of 10k+ international events, covering 117+ behaviors, across 475 international Crises (1918-2015).
Method: (1) Develop a custom ontology (2) train a team of coders and systmetically applied the coding scheme to source texts (3) introduce the Synthetic Historical Narrative which is the tally of all events mentioned in a large corpus of documents which we then use to benchmark our event dataset as well as our nearest competitors (4) fully automated the pipeline using LLMs on commodity hardware.
Stack: Lamma 2, Hierarchical clustering on graphs , spaCy , Shiny , UMAP, large language model fine tuned for paraphrase detection (mpnet).
Resources: Website: CrisisEvents.org | Github | Paper | Appendix | Codebook
“Introducing the ICBe Dataset: Very High Recall and Precision Event Extraction from Narratives about International Crises.” (with Thomas Leo Scherer, J. Andrés Gannon, Erik Gartzke, Jon Lindsay, Shannon Carcelli, Jonathan Wiklenfeld, David M. Quinn, Catherine Aiken, Jose Miguel Cabezas Navarro, Neil Lund, Egle Murauskaite, and Diana Partridge). 2022. arXiv:2202.07081.
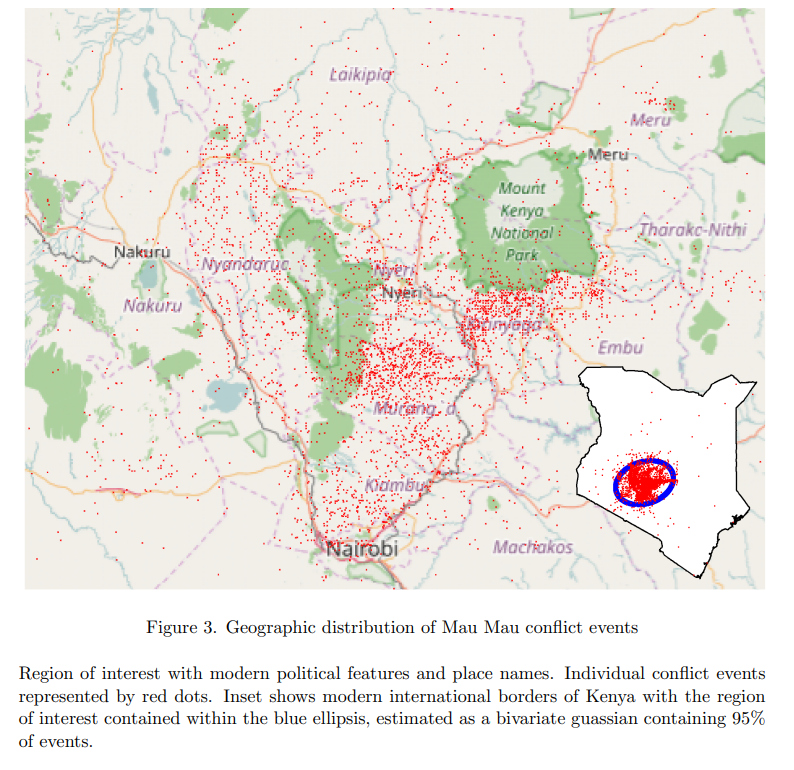
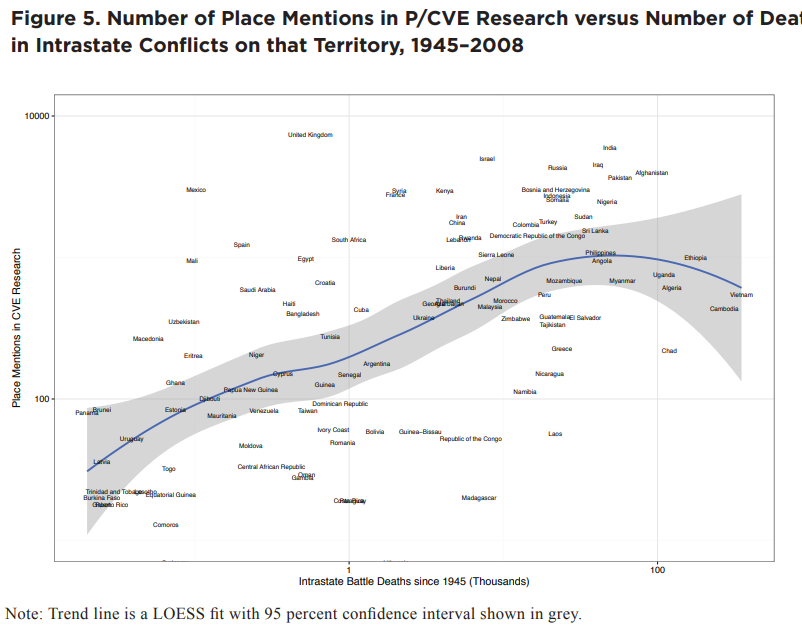
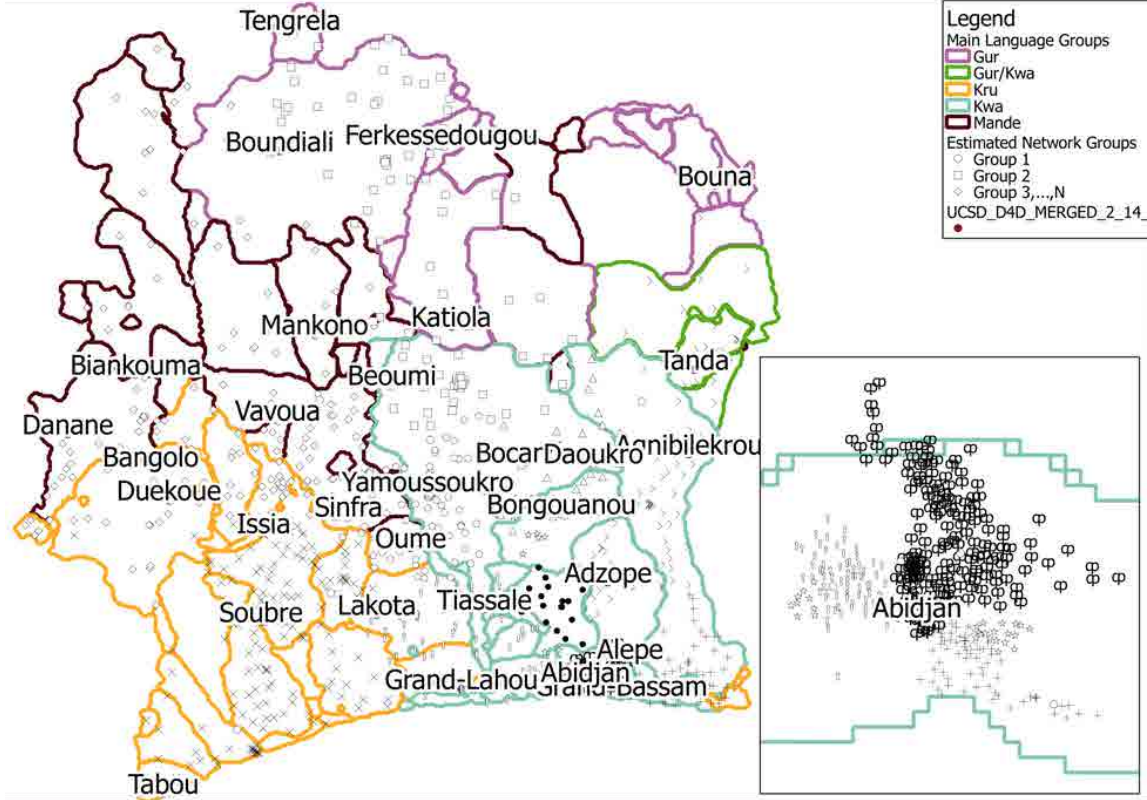
8. Georeferencing Accuracy

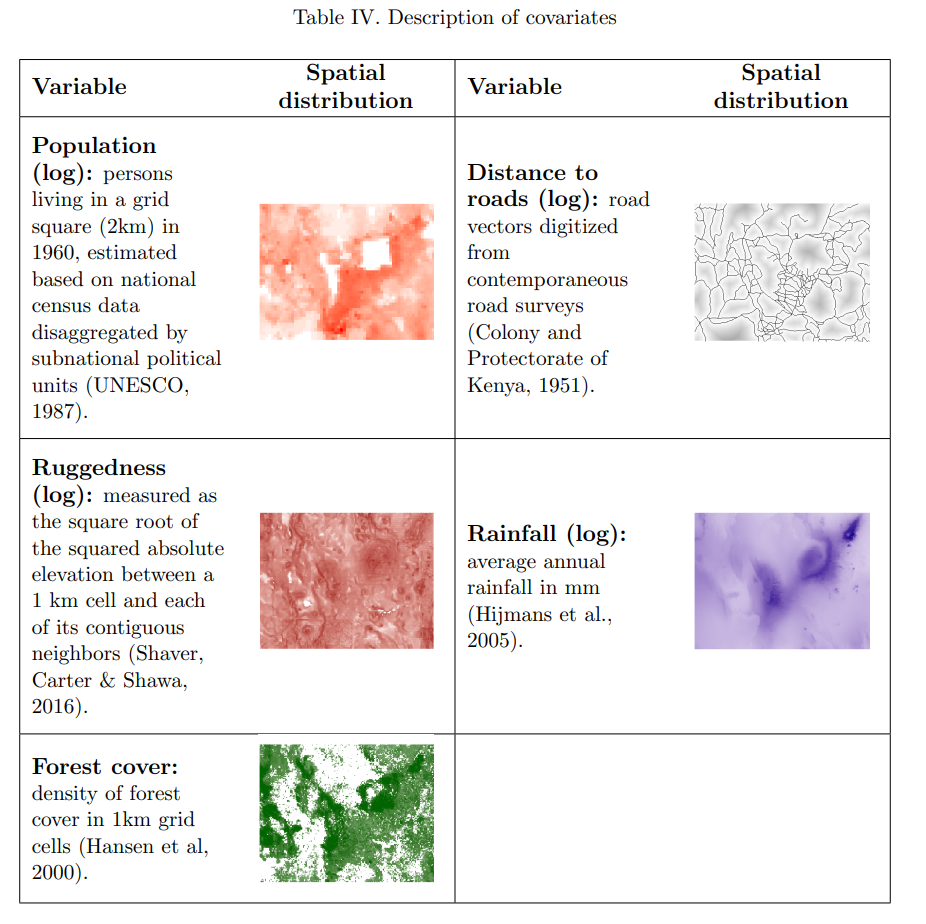
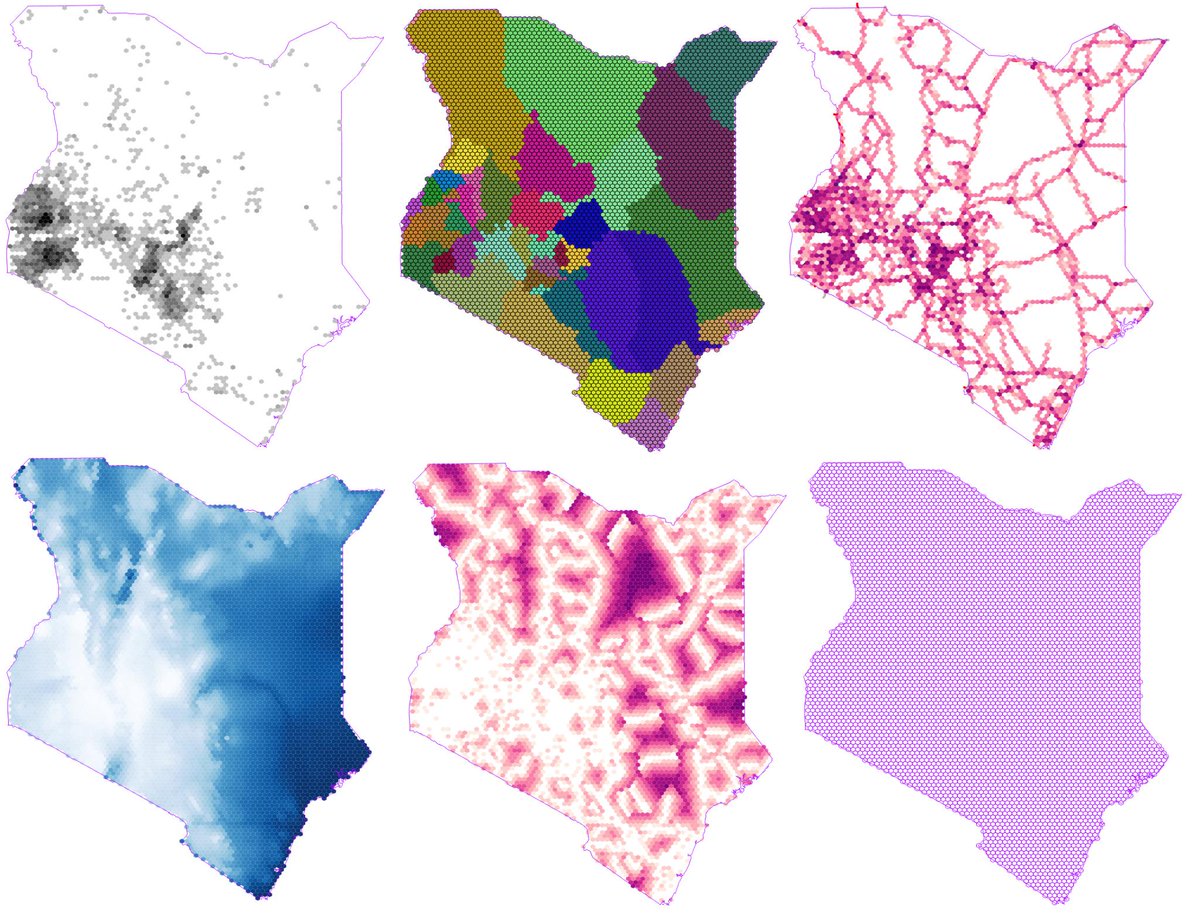
Result: We show which natural language geo-referencing strategy you choose determines what downstream econometric result you’ll find.
Method: (1) Develop a dataset of ten thousand events from the Mau Mau rebellion, drawn from twenty thousand pages of historical intelligence documents (2) apply over a dozen geo-referencing strategies (3) benchmark them against a known ground-truth in the form of exact military grid coordinates which were available for a subset of the reports.
Stack: Xgboost, Locality Sensitive Hashing
Resources: “Measuring the Landscape of Civil War” (with Kristen Harkness) Journal of Peace Research, February 15, 2018 [Github], [Ungated Paper], [Ungated Appendix], [Gated Paper]
9. Topic Models for Research Papers
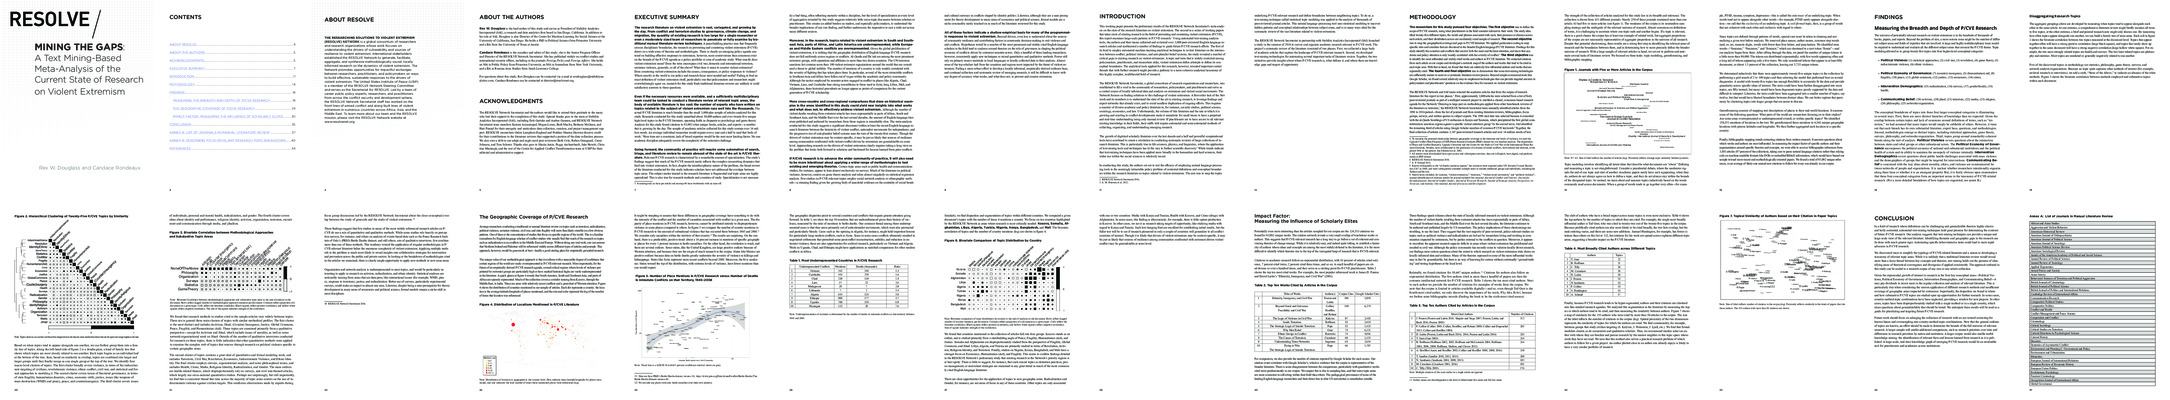
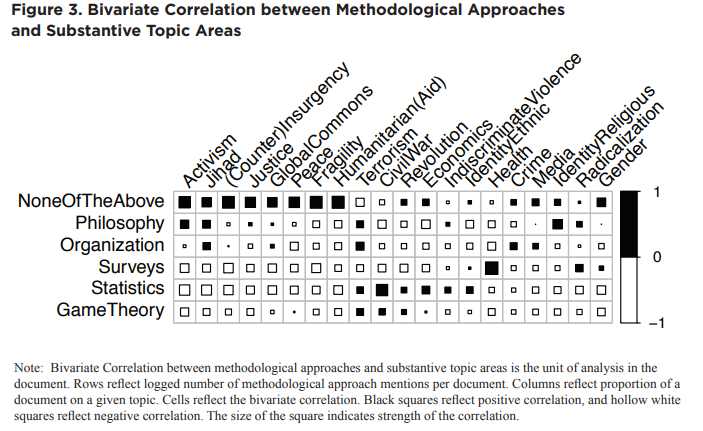
Result: Produced an automated literature review of the most recent 3k articles on political violence.
Method: (1) Structural topic modeling of research questions and methods employed (2) citation network
Stack: STM
Resources: Ungated PDF
10. Diplomatic Telegrams
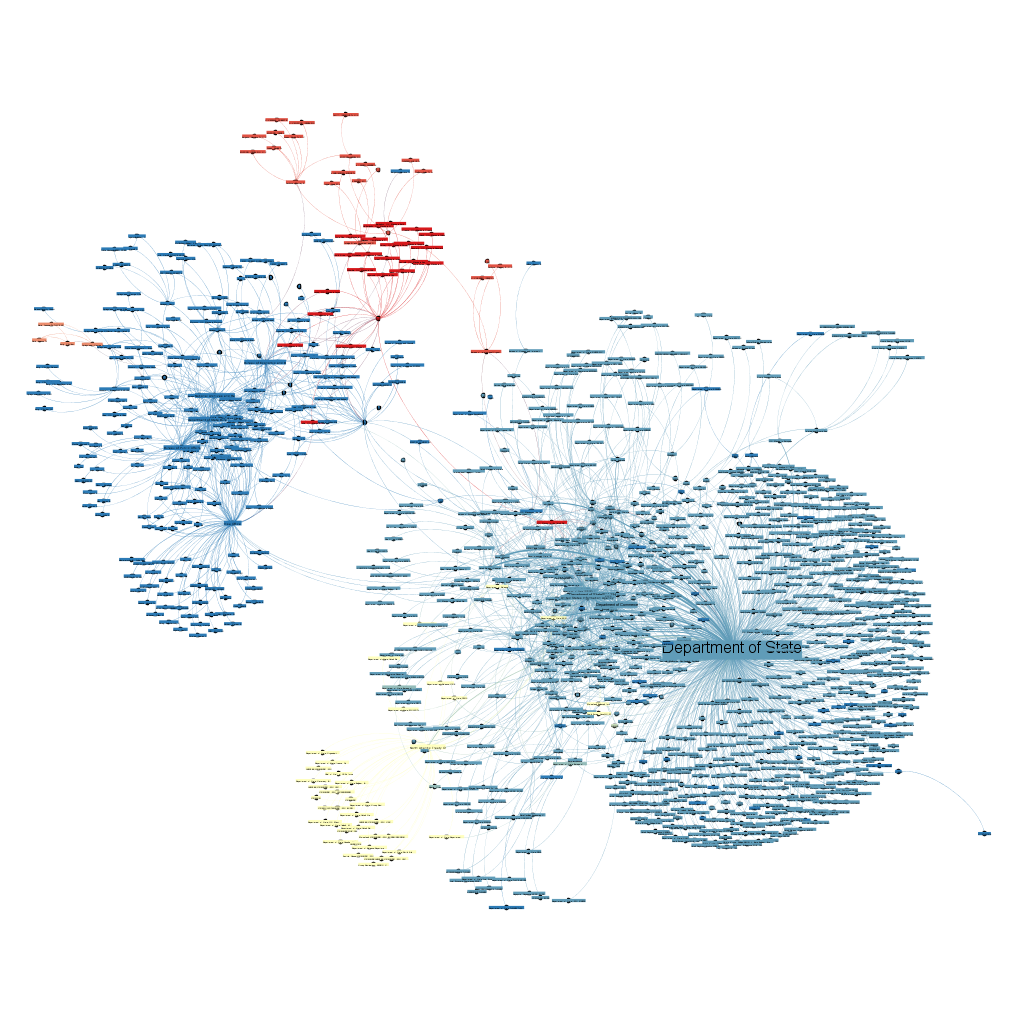
Result: Compute measures of centrality and affinity between international actors based on messages between them and the U.S. State Department
Method: (1) Create a directed dyad graph of communications between actors (2) compute network measures like centrality, affinity, etc. (3) stress test using different possible measures of activity like volume, length, sentiment of communications.
Stack: NetworkX, Igraph
Resources: Developed for a project at Columbia University
11. Named Entities for Social Science (NESS)

Result: We built an open entity resolver tuned for historians and policy analysts, so they can track people, orgs, and equipment across archives without bespoke NLP work. NESS delivers time‑stamped, versioned entities (people/orgs/places) tuned for research workflows, with links to external KBs and analysis‑ready exports.
Method: Domain‑tuned NER; 2) Disambiguation/linking; 3) KB alignment; 4) Data contracts for downstream tasks.
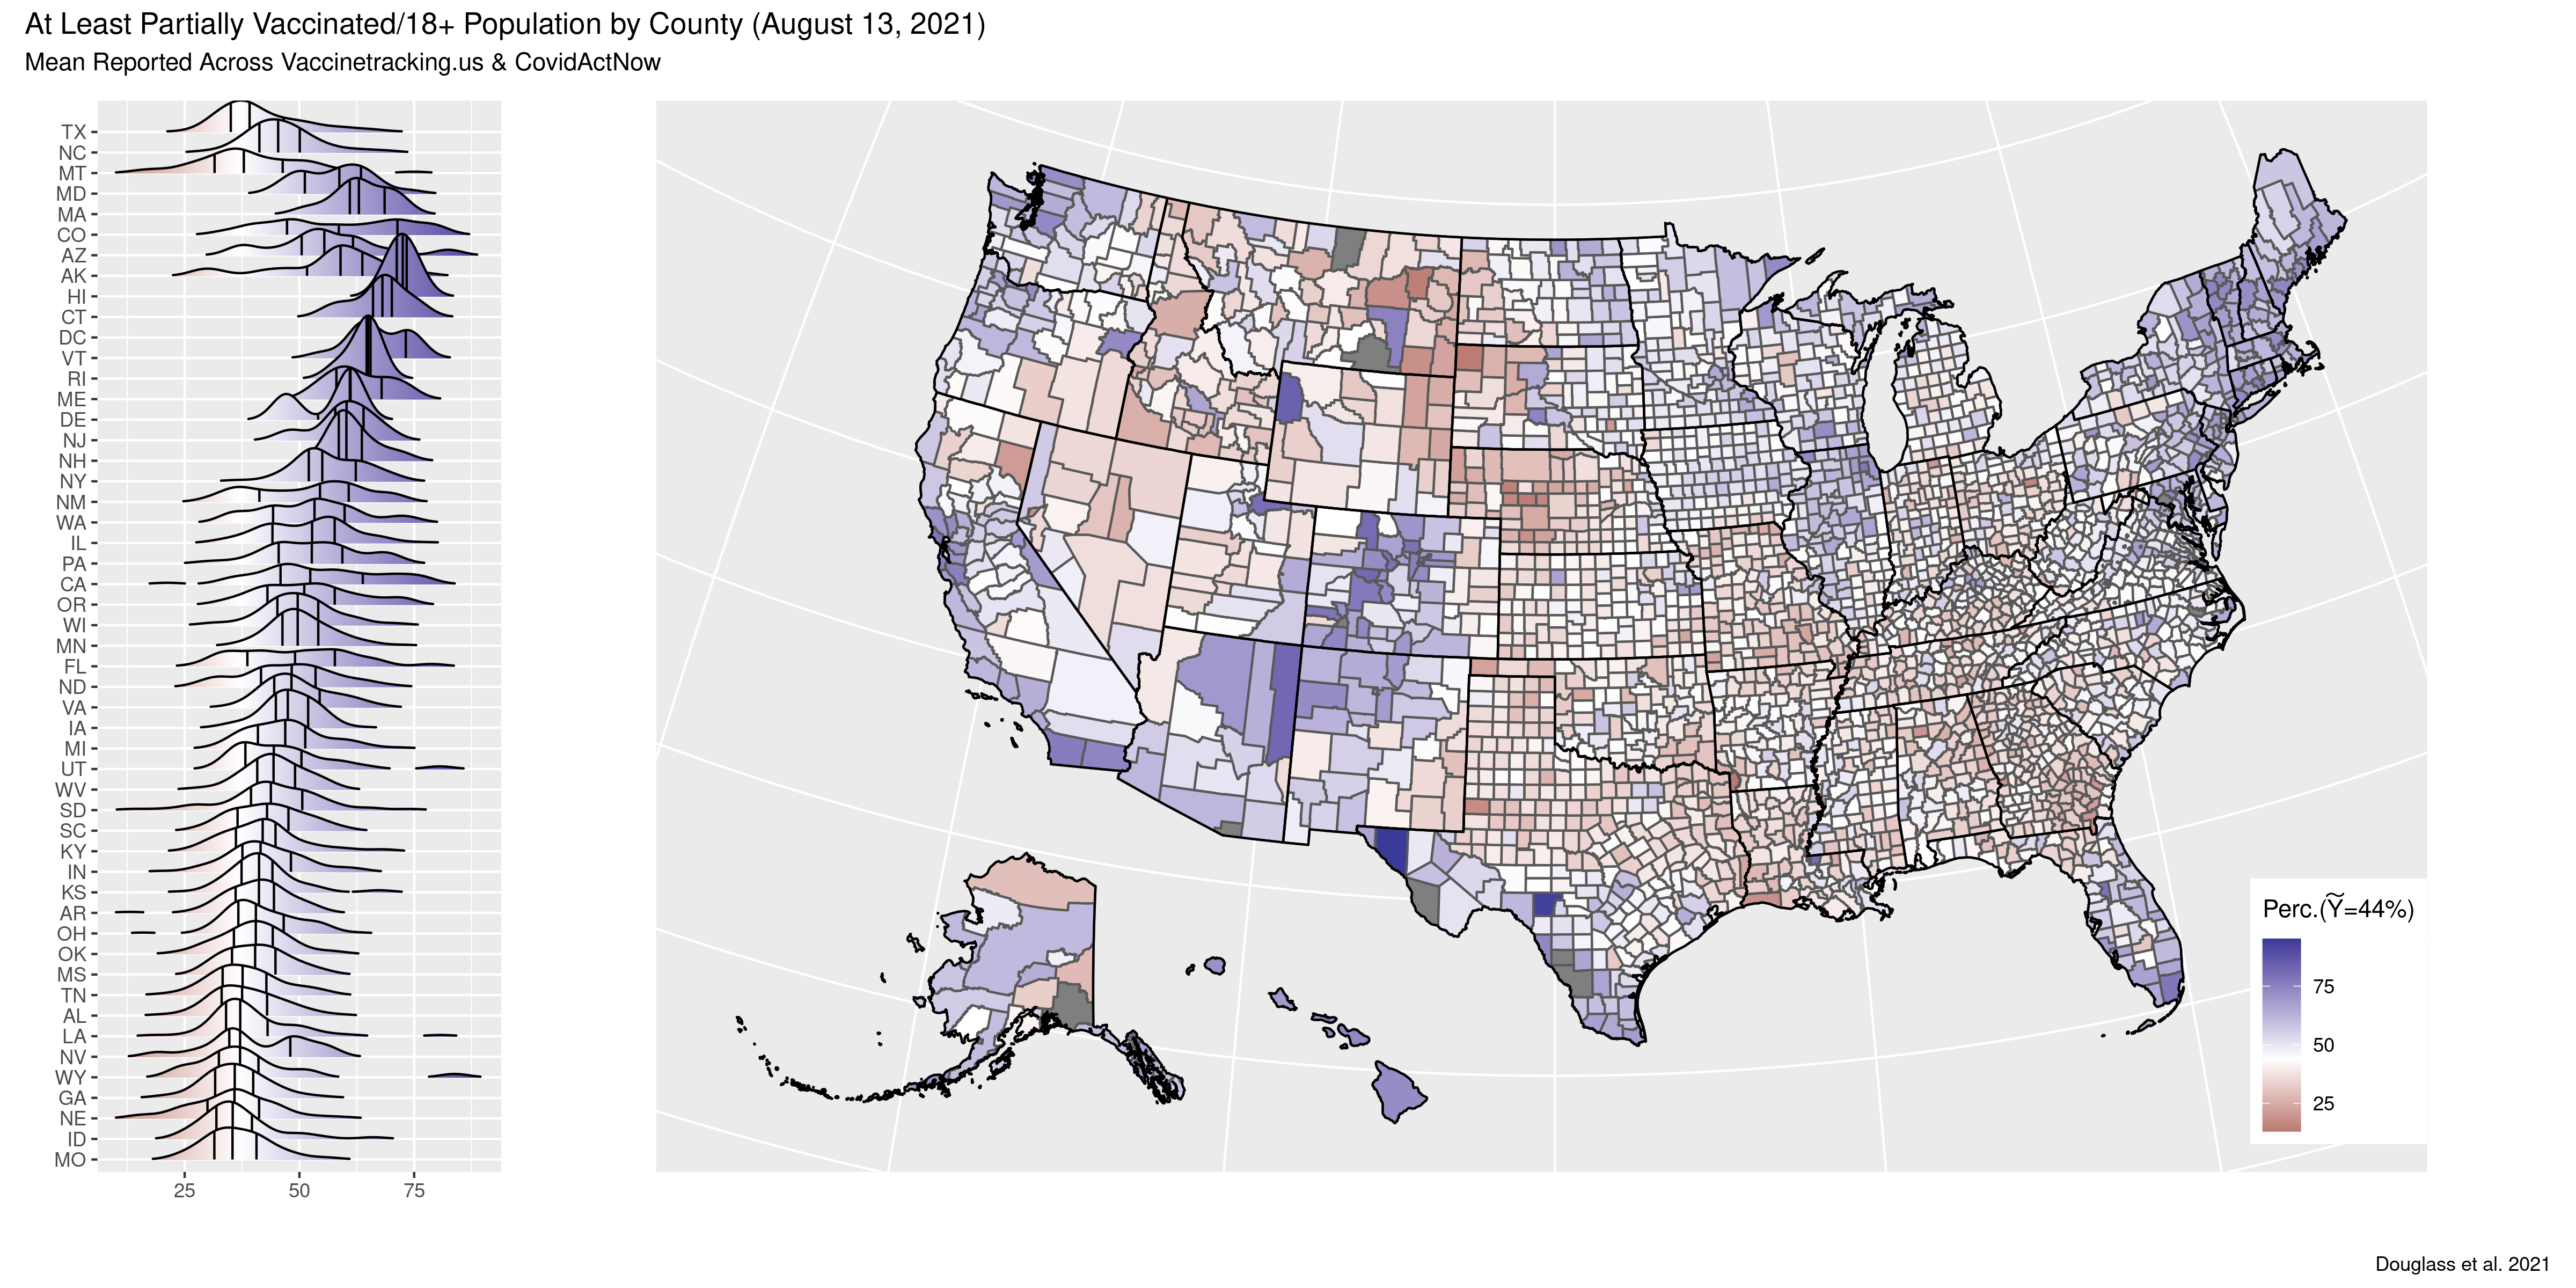
12. COVID-19 Analytics

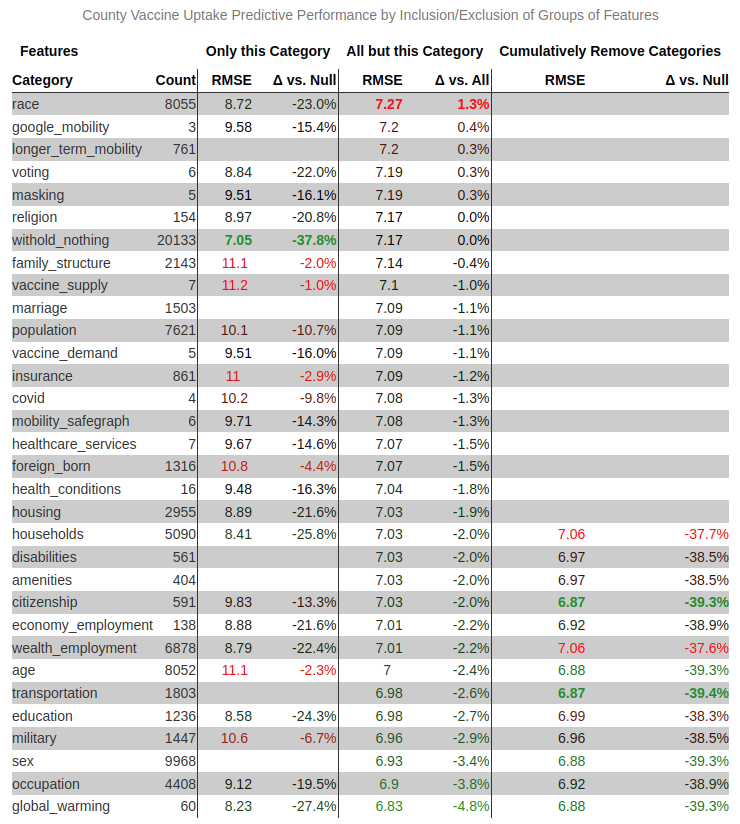
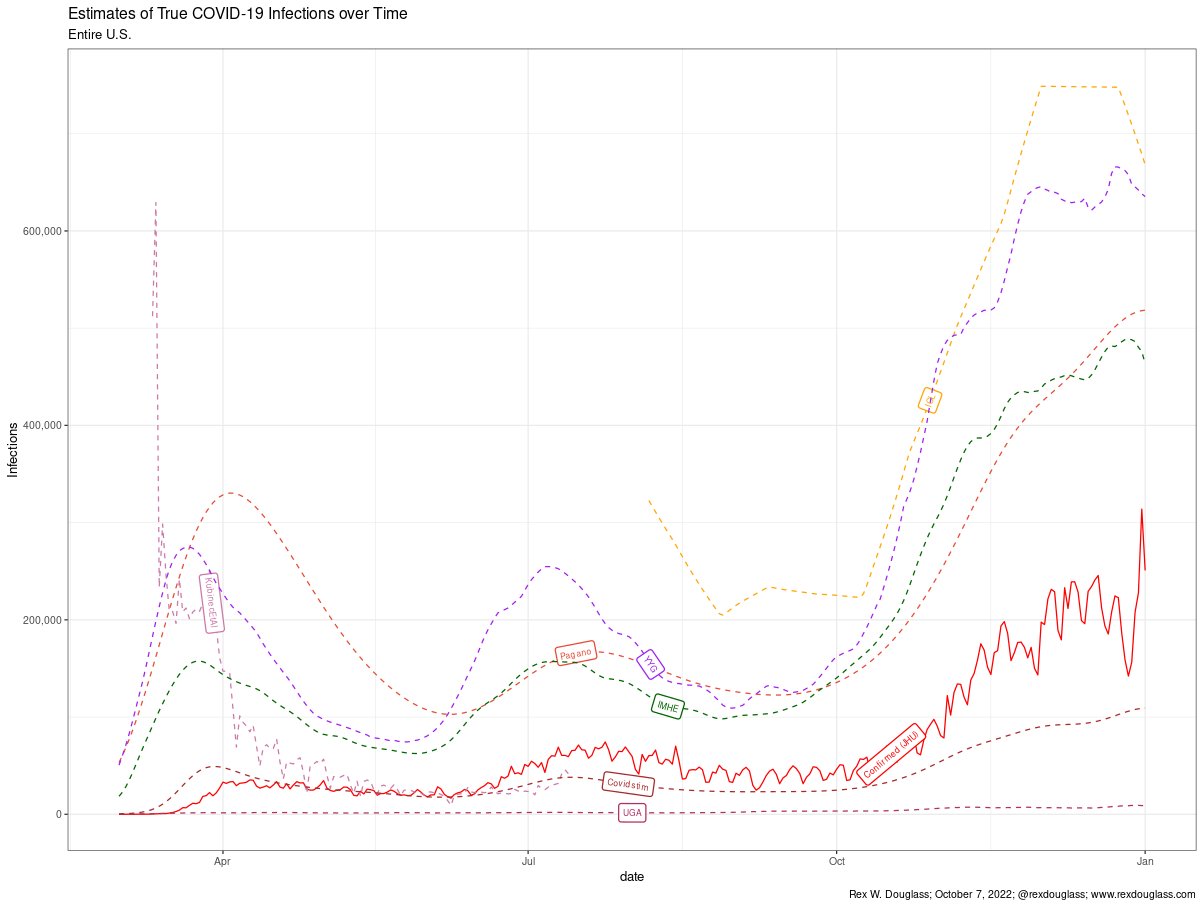
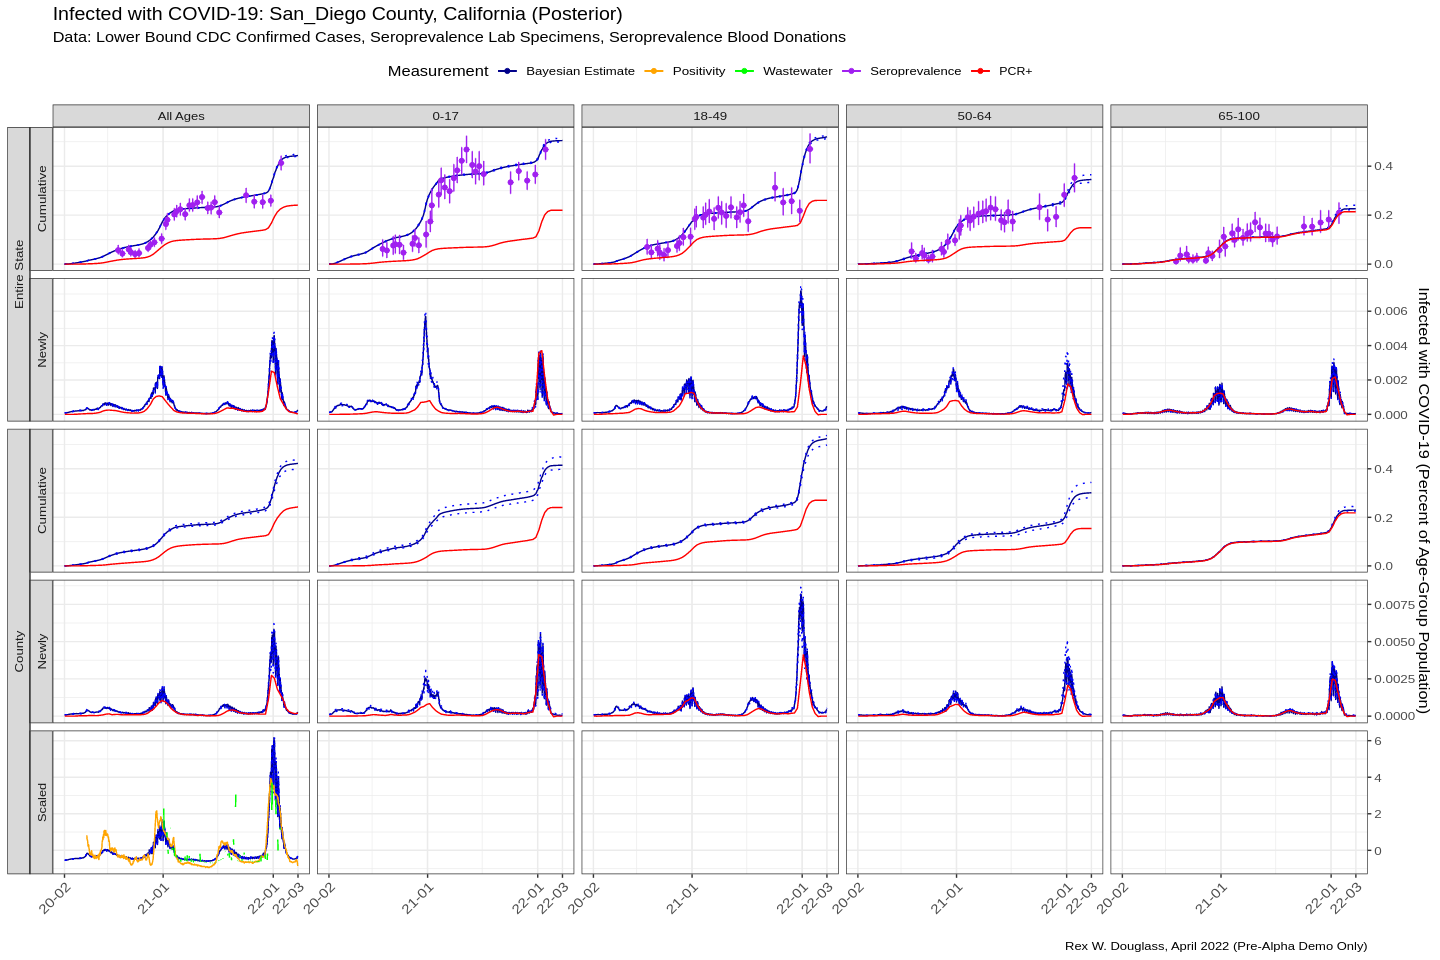
Result: Estimated COVID-19 infections at a very high resolution of the age group-county-day. Modeled vaccine uptake as a function of over 1k county level covariates.
Method: (1) Hiearchical latent bayesian estimates (2) combining five kinds of evidence (a) wastewater detections (b) reported infections (c) serpositive blood samples (d) test positivity rates and (e) deaths.
Stack: Jax, Numpyro, LightGBM
Resources: [Paper] [Paper Open Access] [Media: Wired] [Media: Slate] [Media: king5]
Replication of ‘Substantial underestimation of SARS-CoV-2 infection in the United States’ (We et al. 2020)]
How to be Curious Instead of Contrarian About COVID-19: Eight Data Science Lessons From ‘Coronavirus Perspective’ (Epstein 2020), March 30, 2020
13. Population Estimates from CellPhone Calls
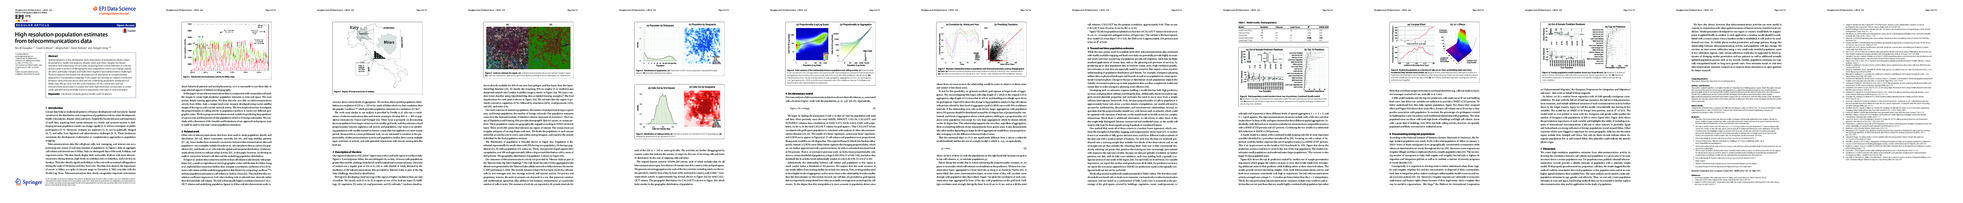
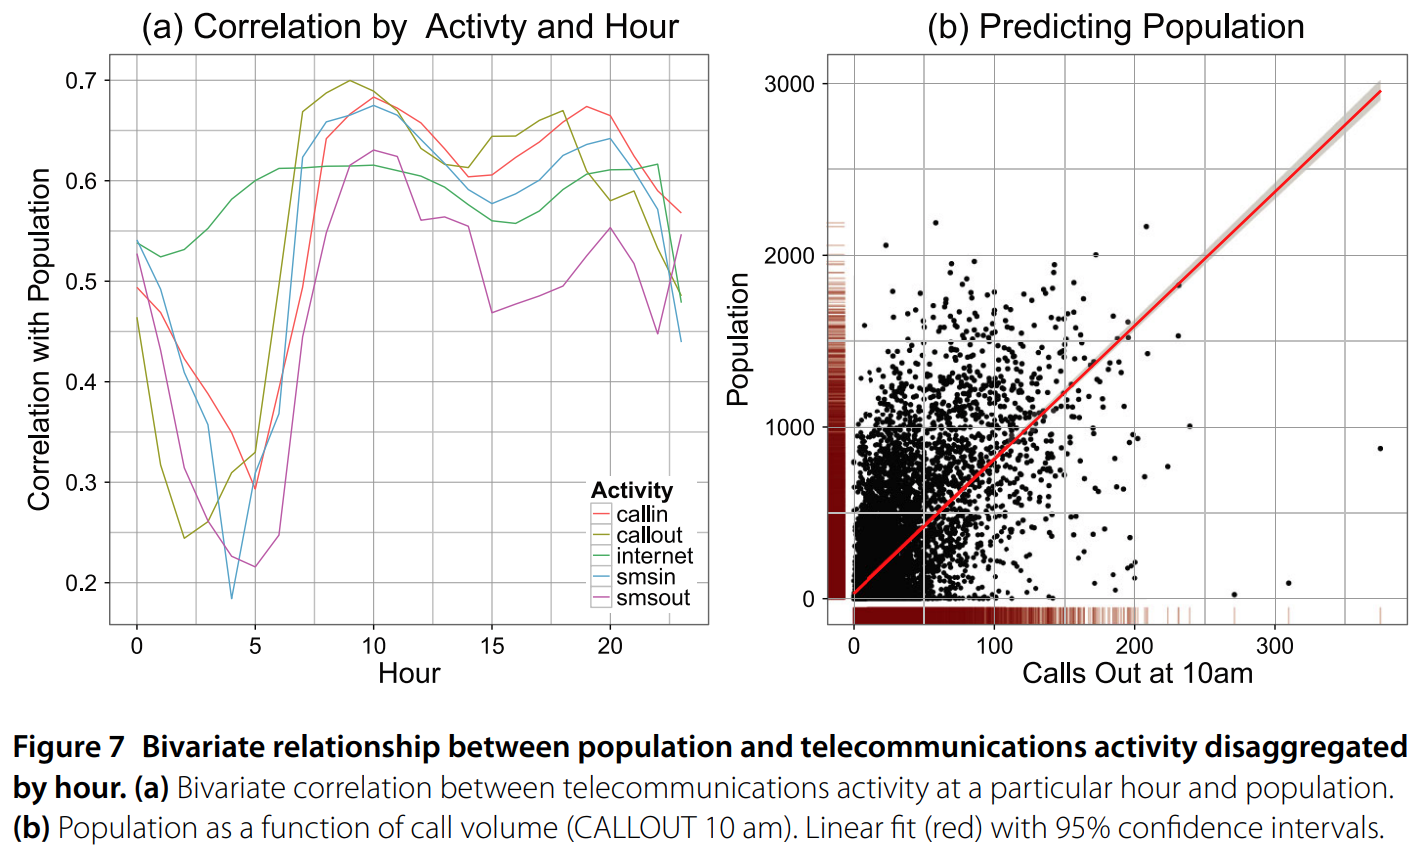
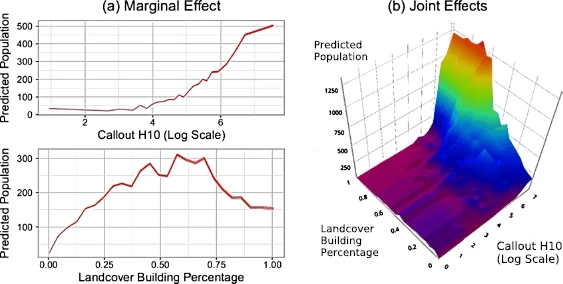
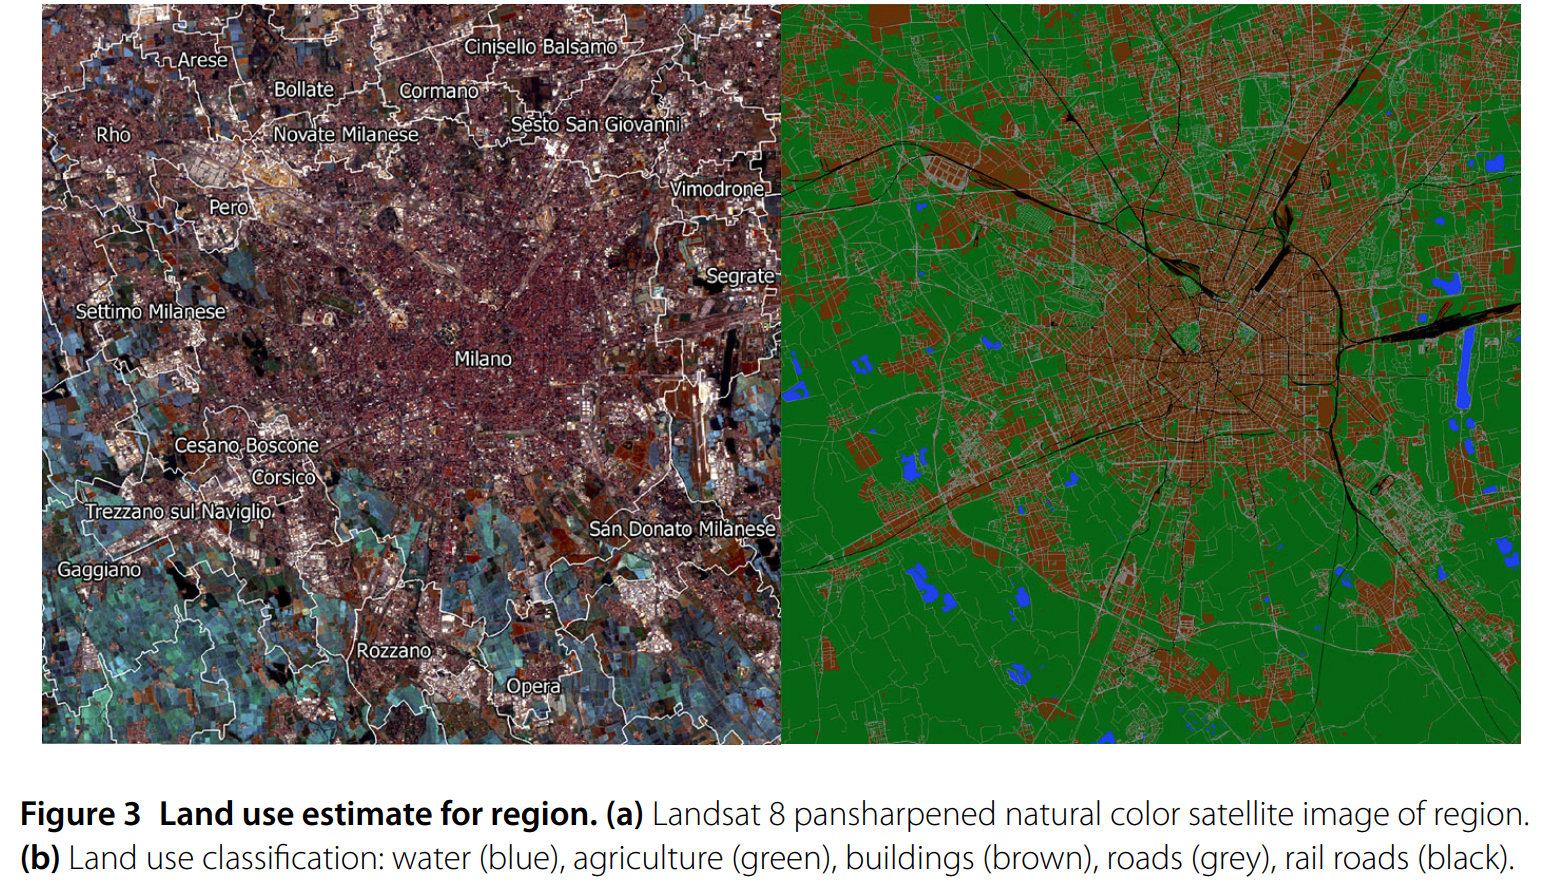
Result: Estimated population in Milan Italy at a resolution of 235m sq grid cells using cell phone call volume and satallite base land use classification.
Method: (1) Use Landsat imagery and Open Street Map to create a custom land use estimate (2) compute call volume to and from each grid square and predict census population estimates at larger spatial aggregations (3) predict down to smaller grid squares and evaluated on spatial hold outs.
Stack: Random Forest, Spatial Cross Validation
Resources: EPJ Data Science · NetMob Best Paper
14. Forcasting Military Disputes
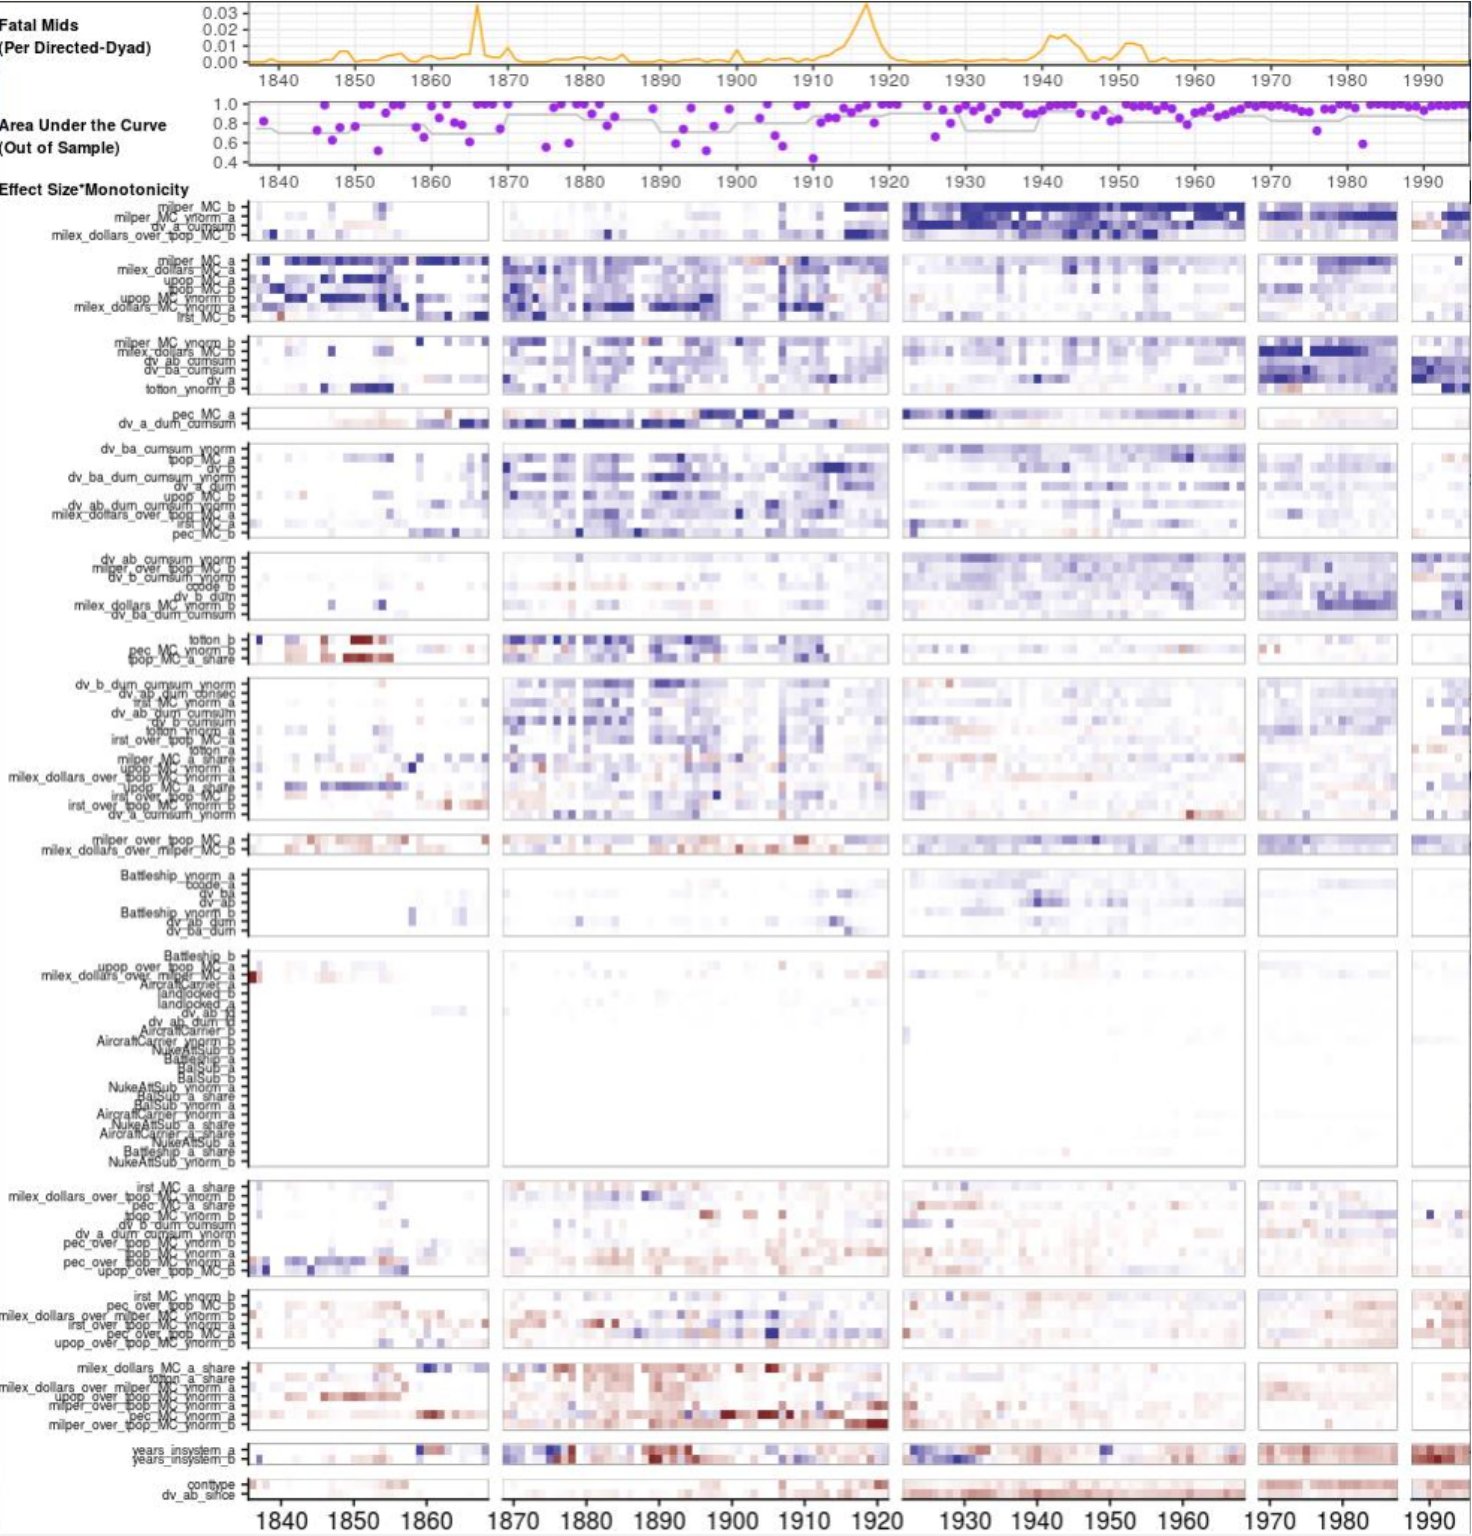
Result: Modeled militerized interstate disputes over the last 100 years as a function of 300+ features in international security.
Method: (1) Develop a cross-validation strategy for rolling future hold outs (2) predict militerized disputes (3) estimate SHAP values and assign contributions to each feature-unit-time period (3) cluster time periods basesd on similar SHAP explainations across features (4) cluster features based on similar SHAP interpretations in different time periods.
Stack: LightGBM, Shapely
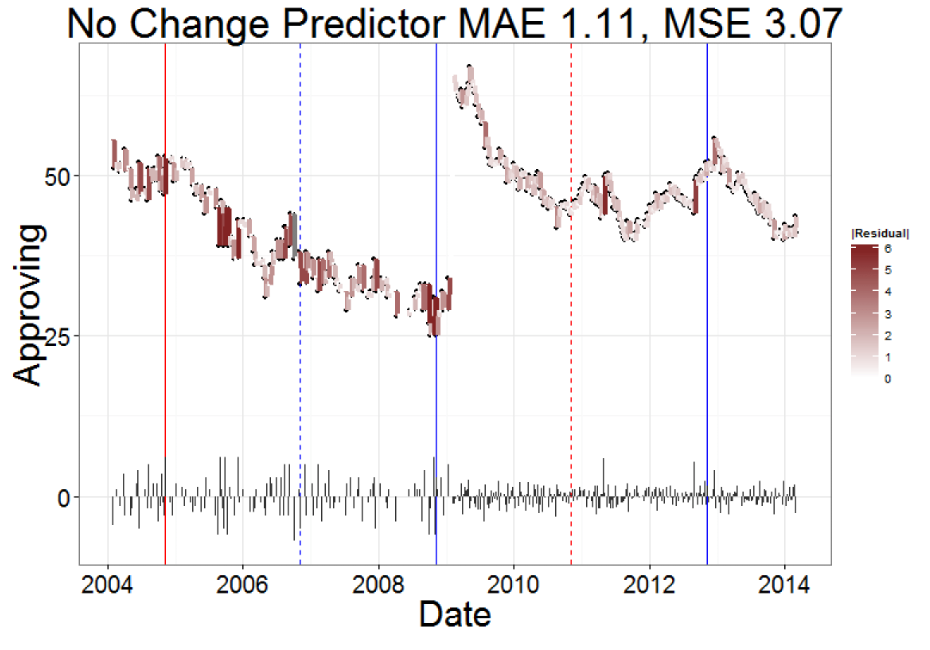
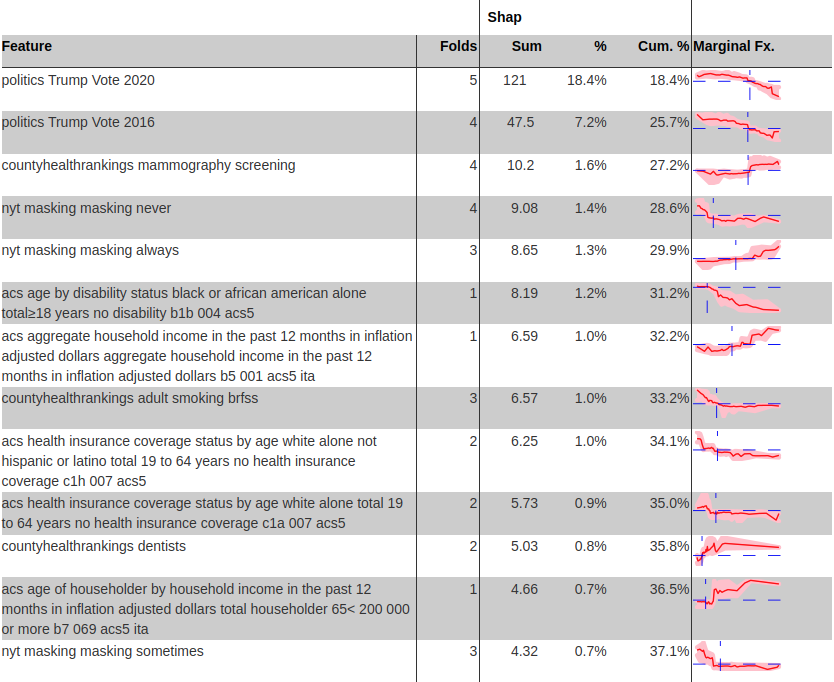
15. Forecasting Public Opinion with Search Behavior

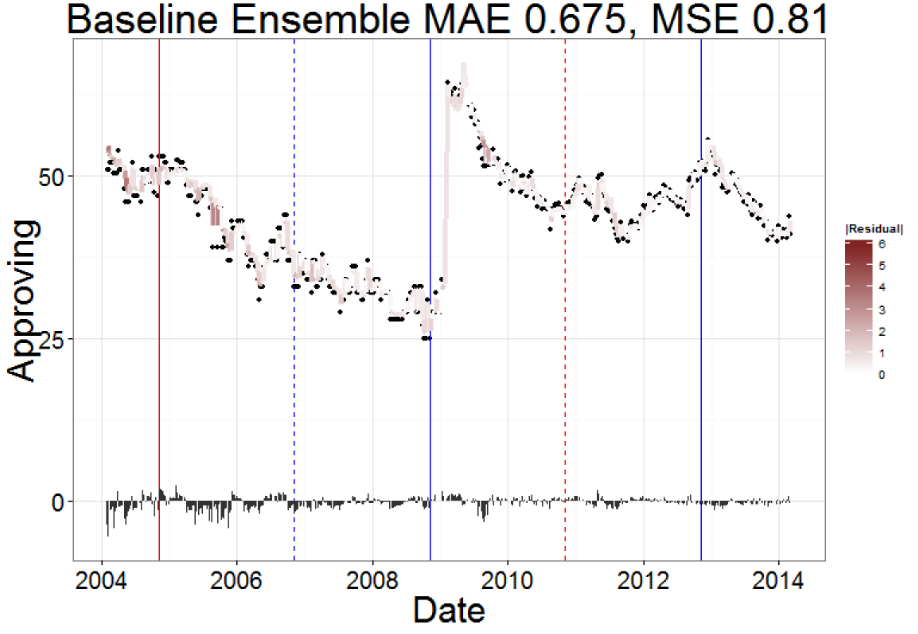
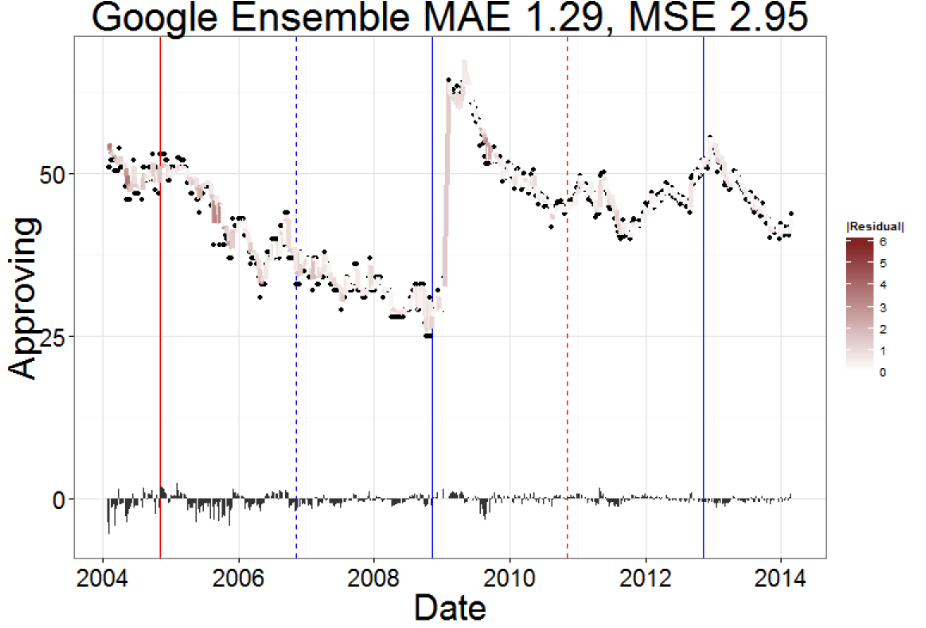
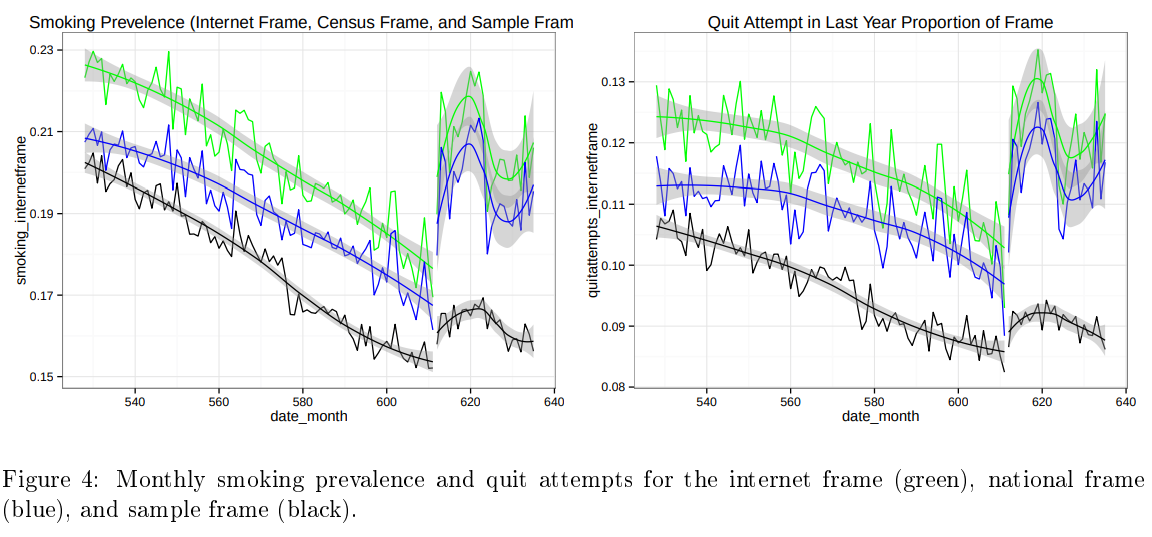
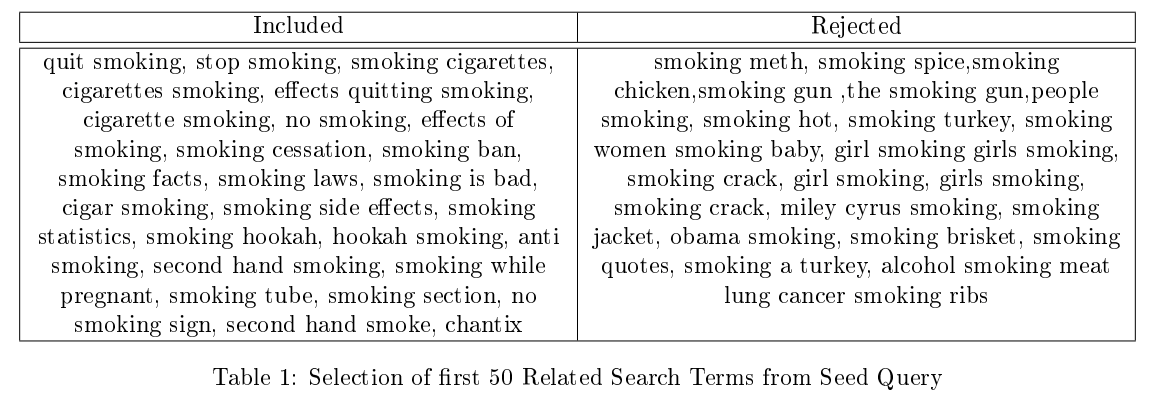
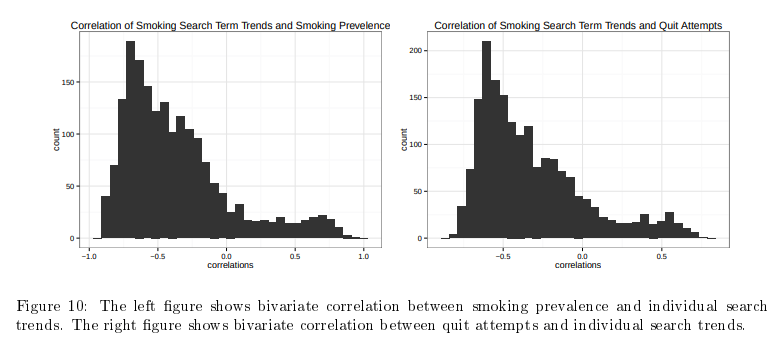
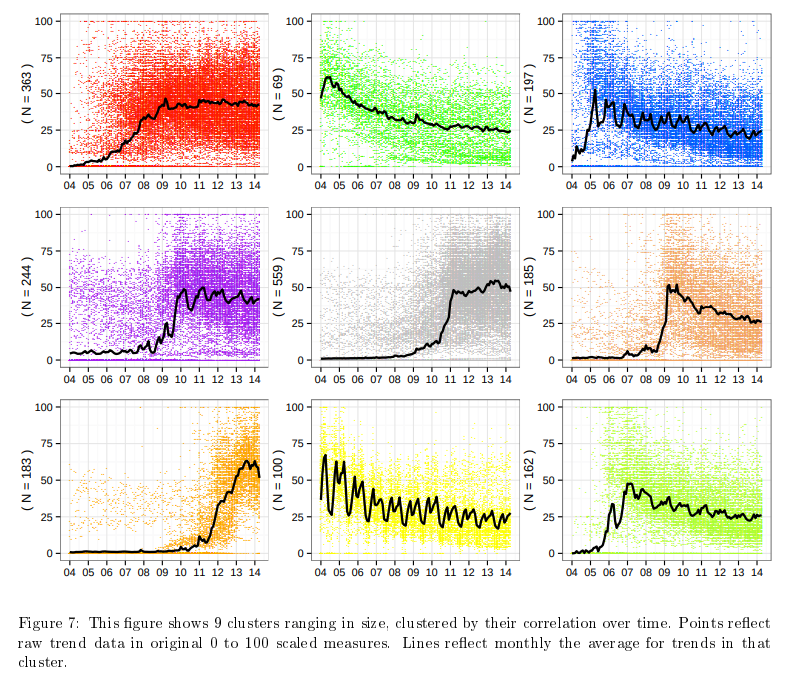
Result: Built a search-behavior ensemble that beat “no change” baselines, highlighting when Google Trends actually adds value to polling models.
Stack: Google Search Trends
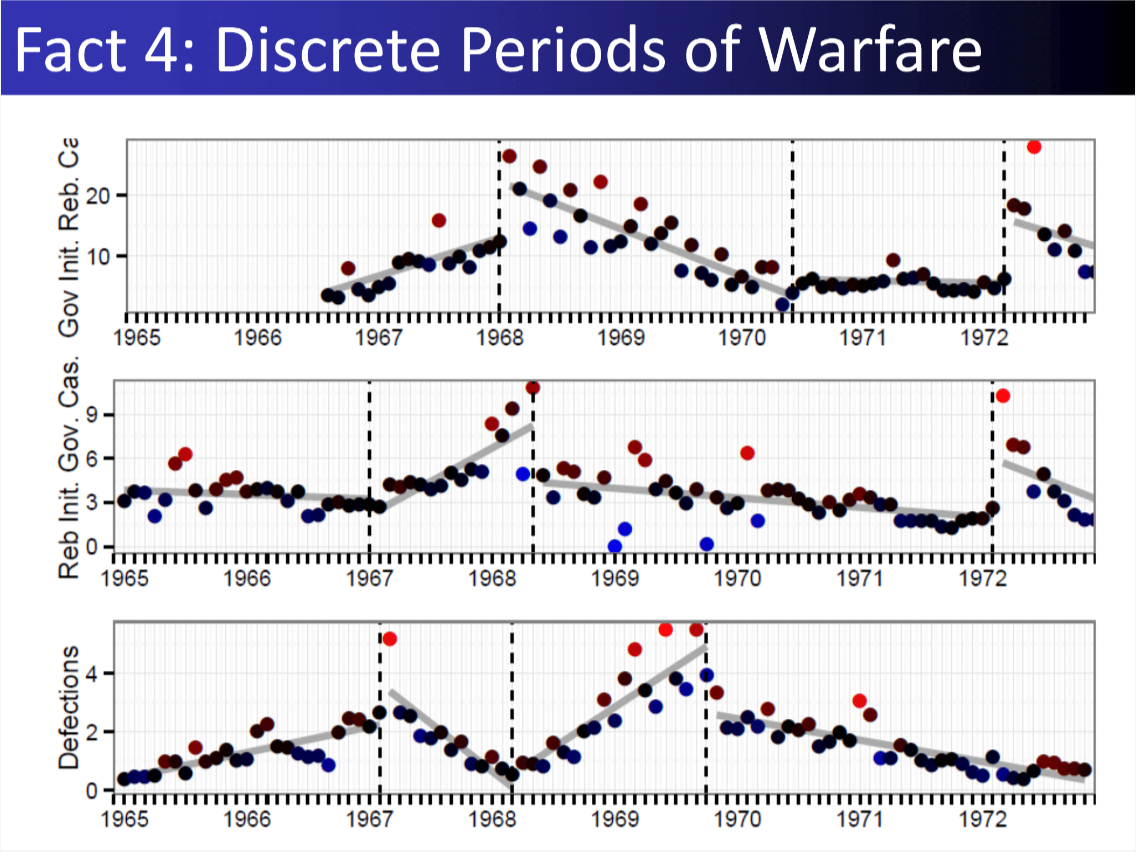
16. Changepoint Detection for Time Series
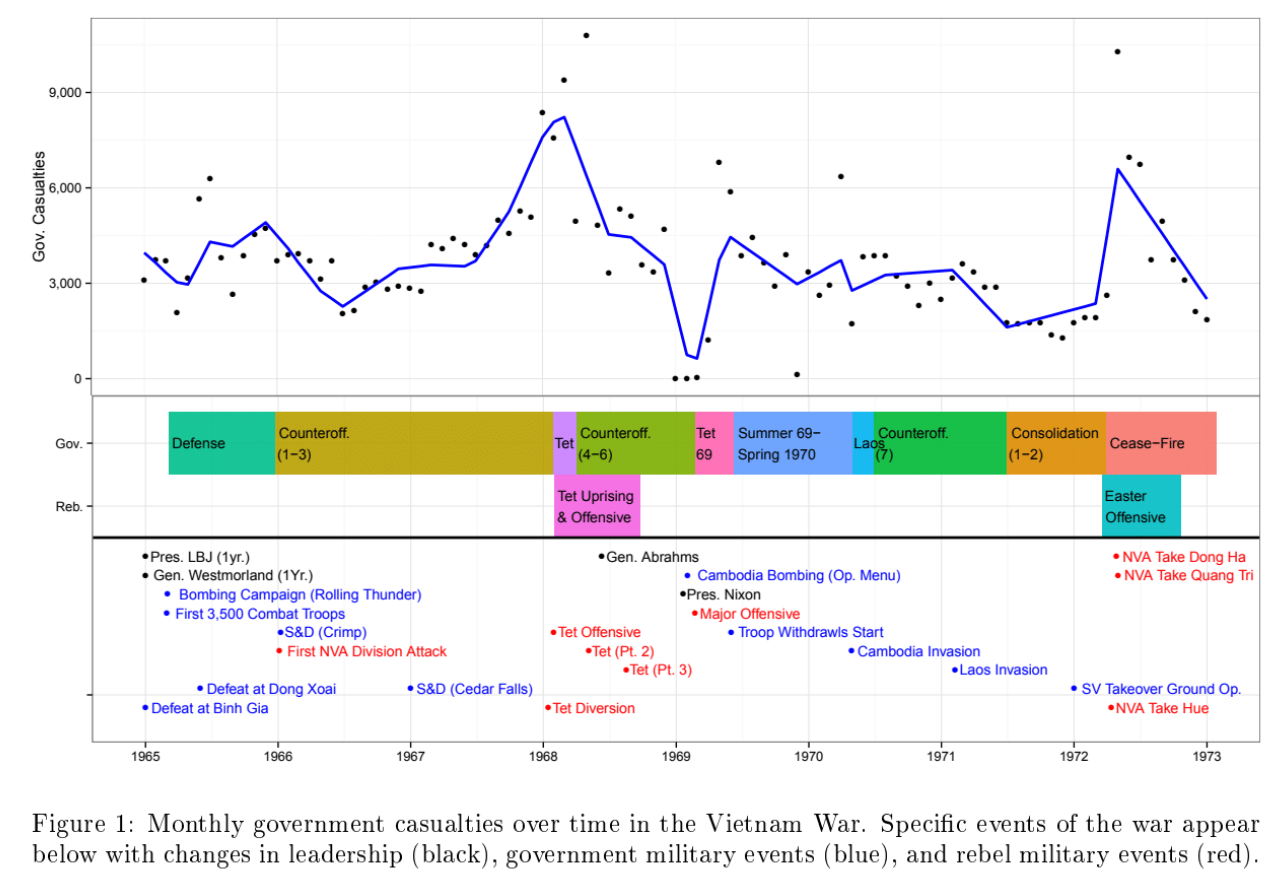
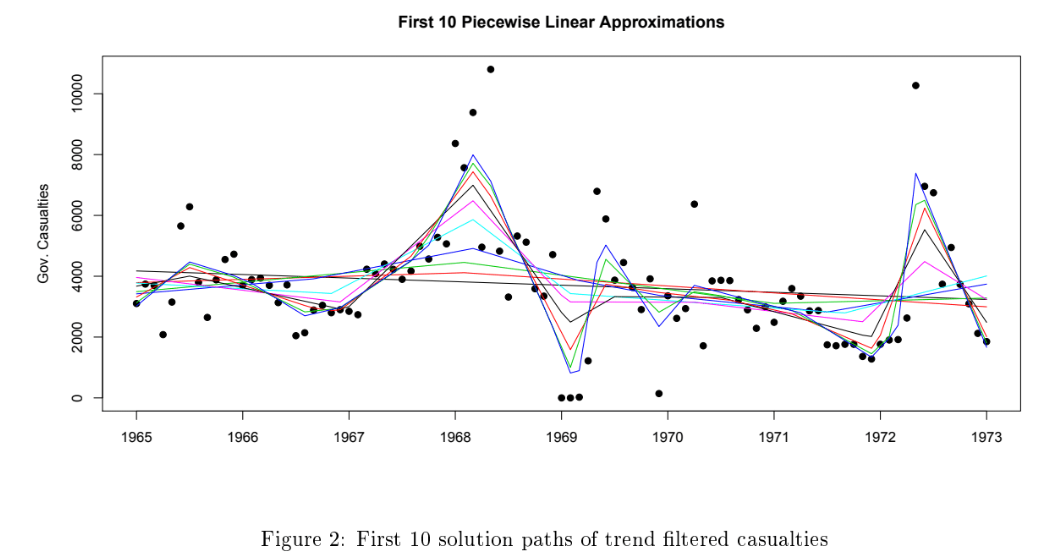
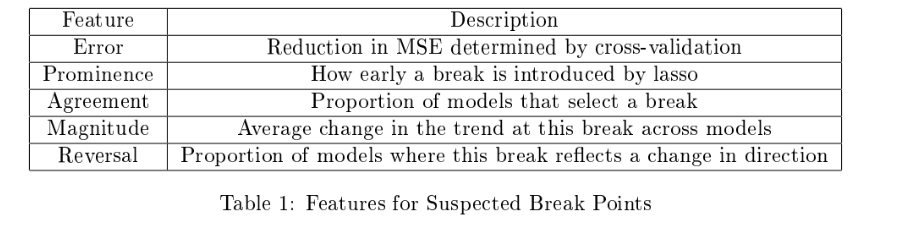
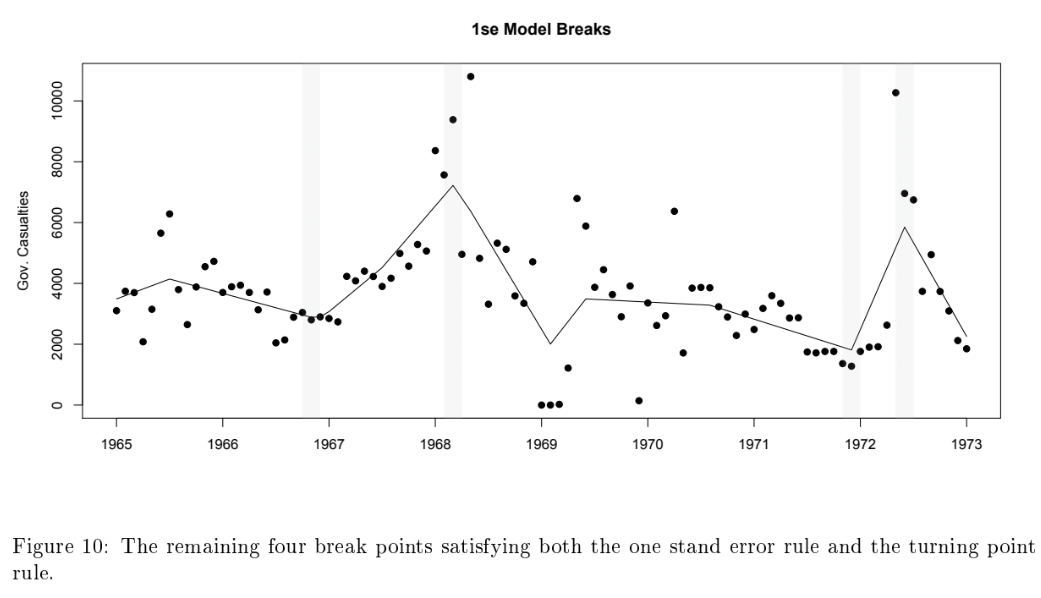
Result: Packaged changepoint diagnostics into analyst-friendly dashboards so we can spot structural breaks before models drift.
Method:
Stack: Lasso
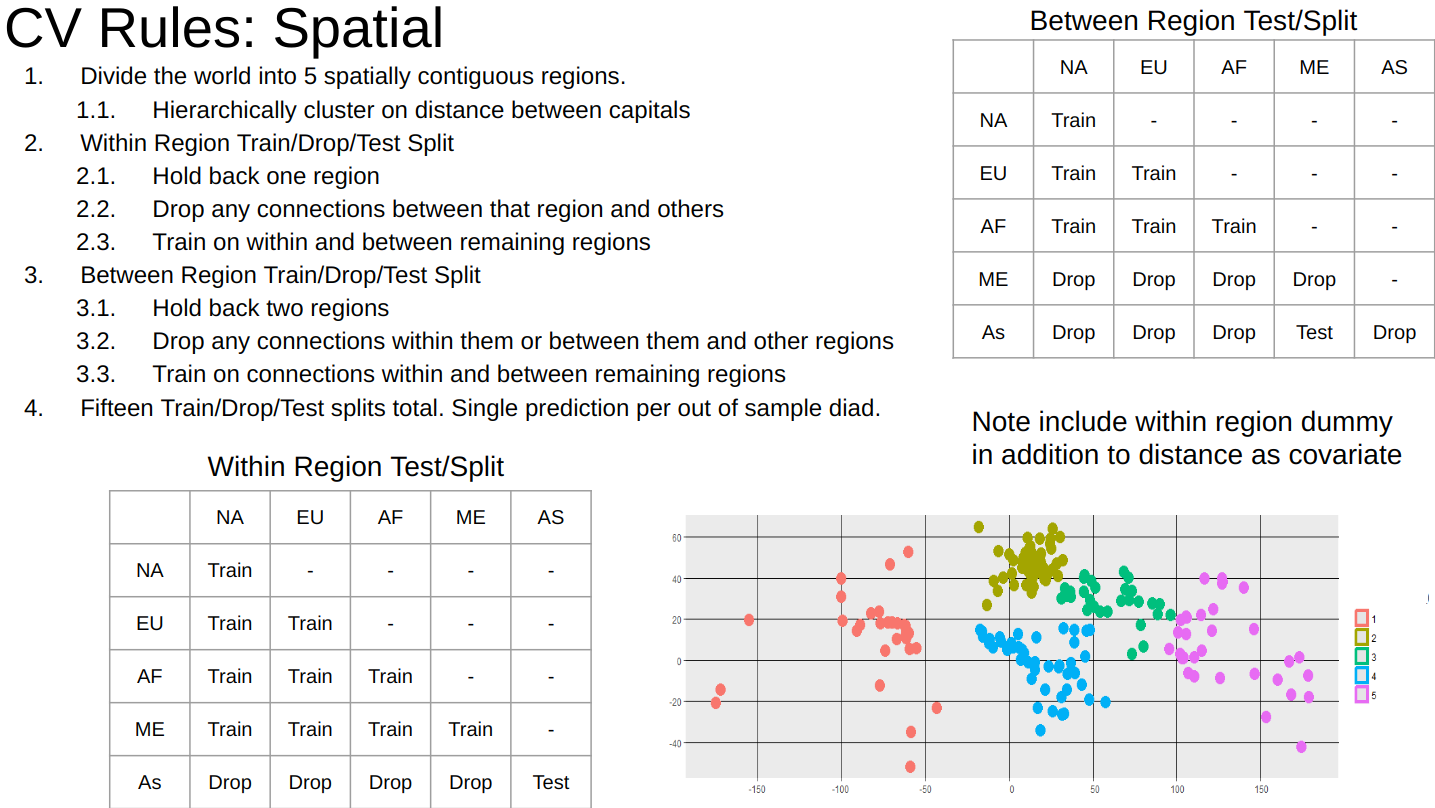
17. Cross-Validation for Spatial Panel Data

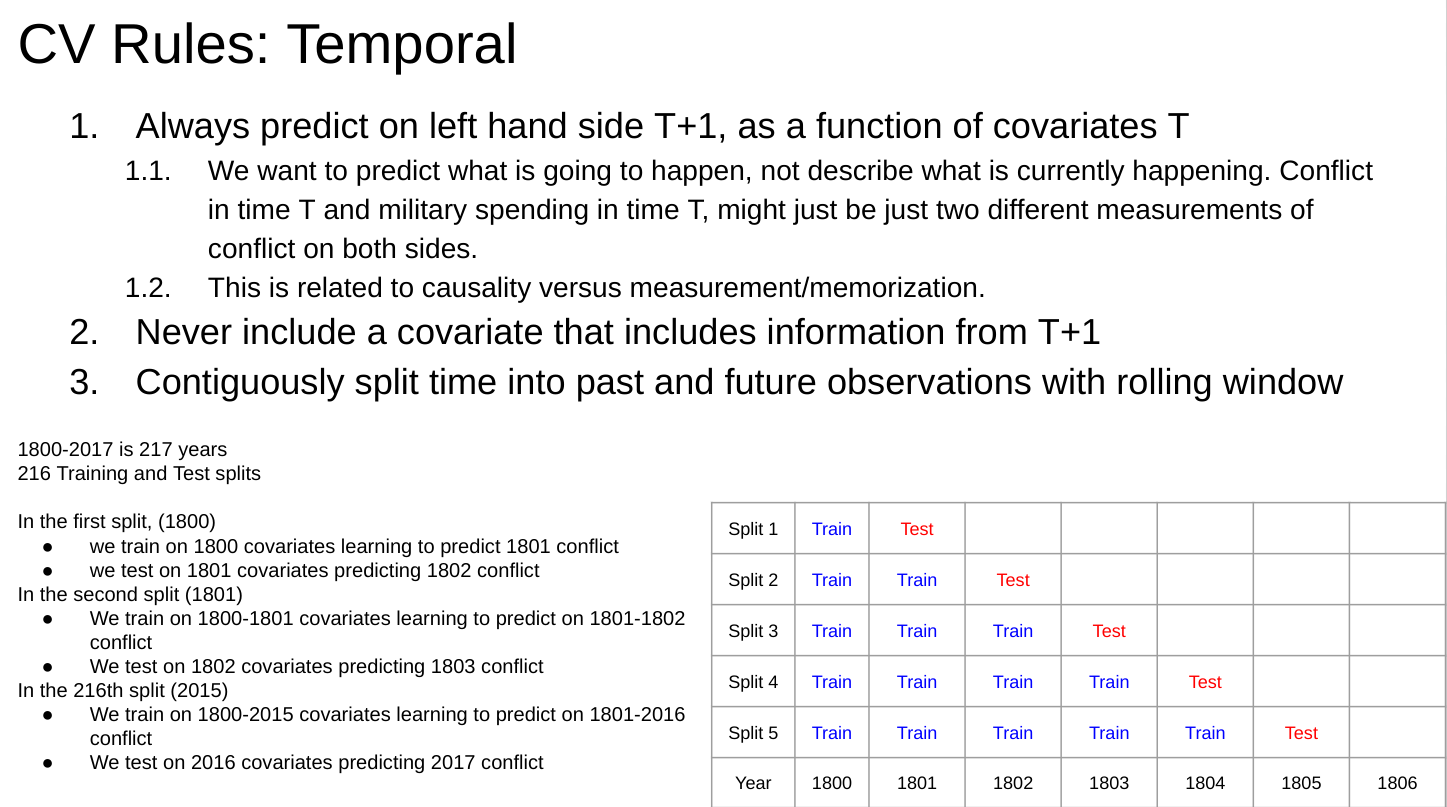
Result: Designed a cross-validation strategy that works on spatial time-series panel data.
Method: (1) Compute temporal, spatial, and network statistics for each entity (2) use a weighted random sampling strategy to propose partitions (3) reject partitions with poor balance or sample sizes (4) choose final optimal partitions.
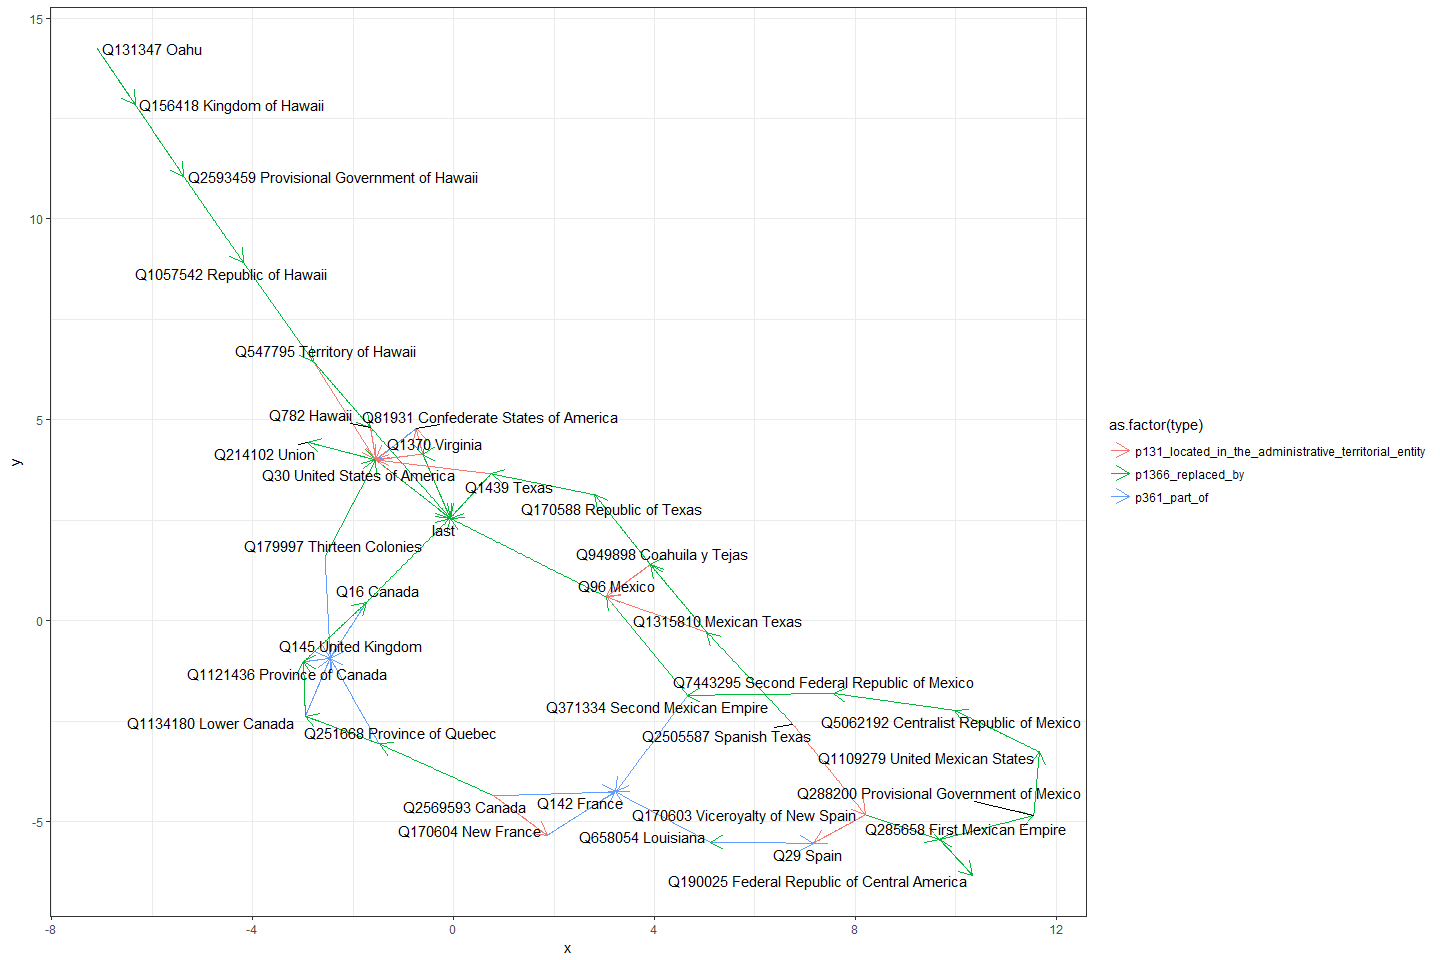
19. Historical Cities and Borders
Result: Build a reconciled, time‑aware gazetteer of cities and borders, enabling distance‑to‑front and territorial‑claim measures over centuries.
Stack: PostGIS · QGIS · Python ETL
20. Remote Sensing for Terrain Difficulty
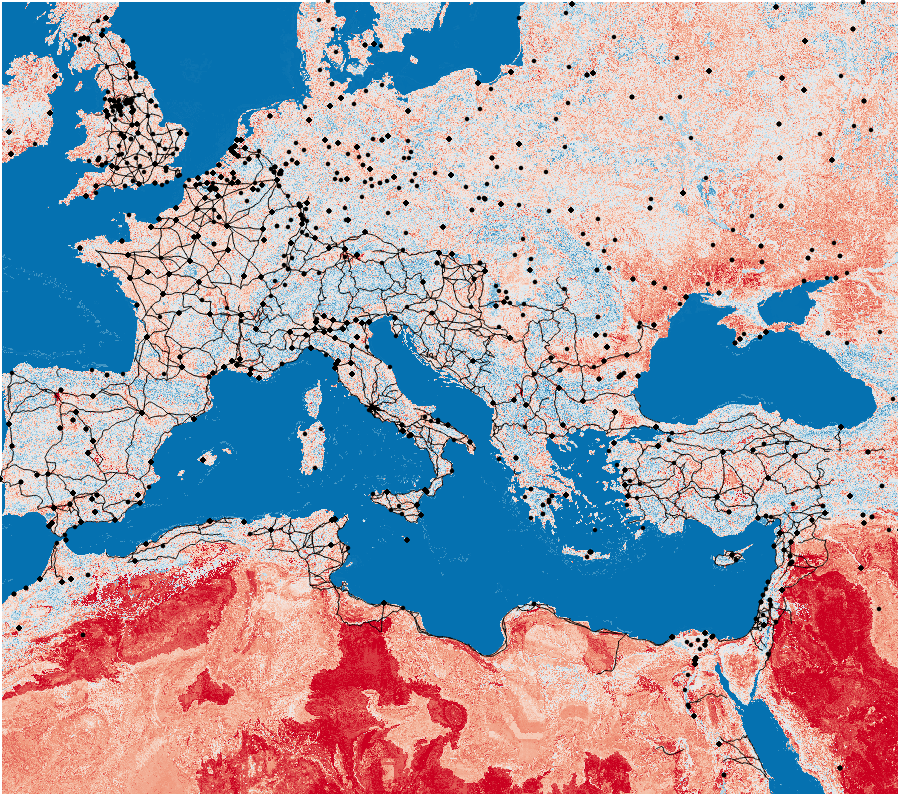
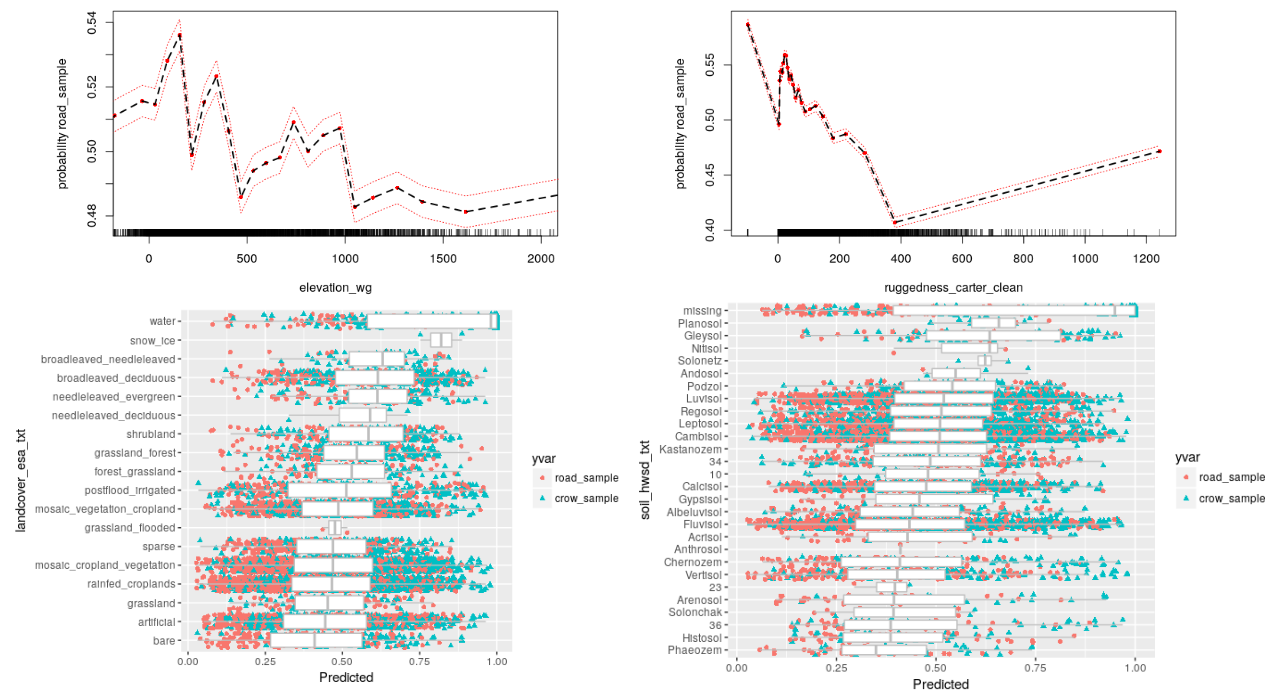
Result: Translated multispectral imagery into on-the-ground travel cost so logistics planners could see red-to-blue mobility gradients at a glance.
Method: (1) Use historical road construction from the Roman Empire as a proxy for difficulty of terrain (2) compute counterfactual roads that would have been shorter to build but weren’t presumably because of terrain (3) rank wise compare points on the observed road to the counterfactual road (4) project the learned relative difficulty out to all points worldwide.
Stack: Random Forest
21. Nuclear Proliferation
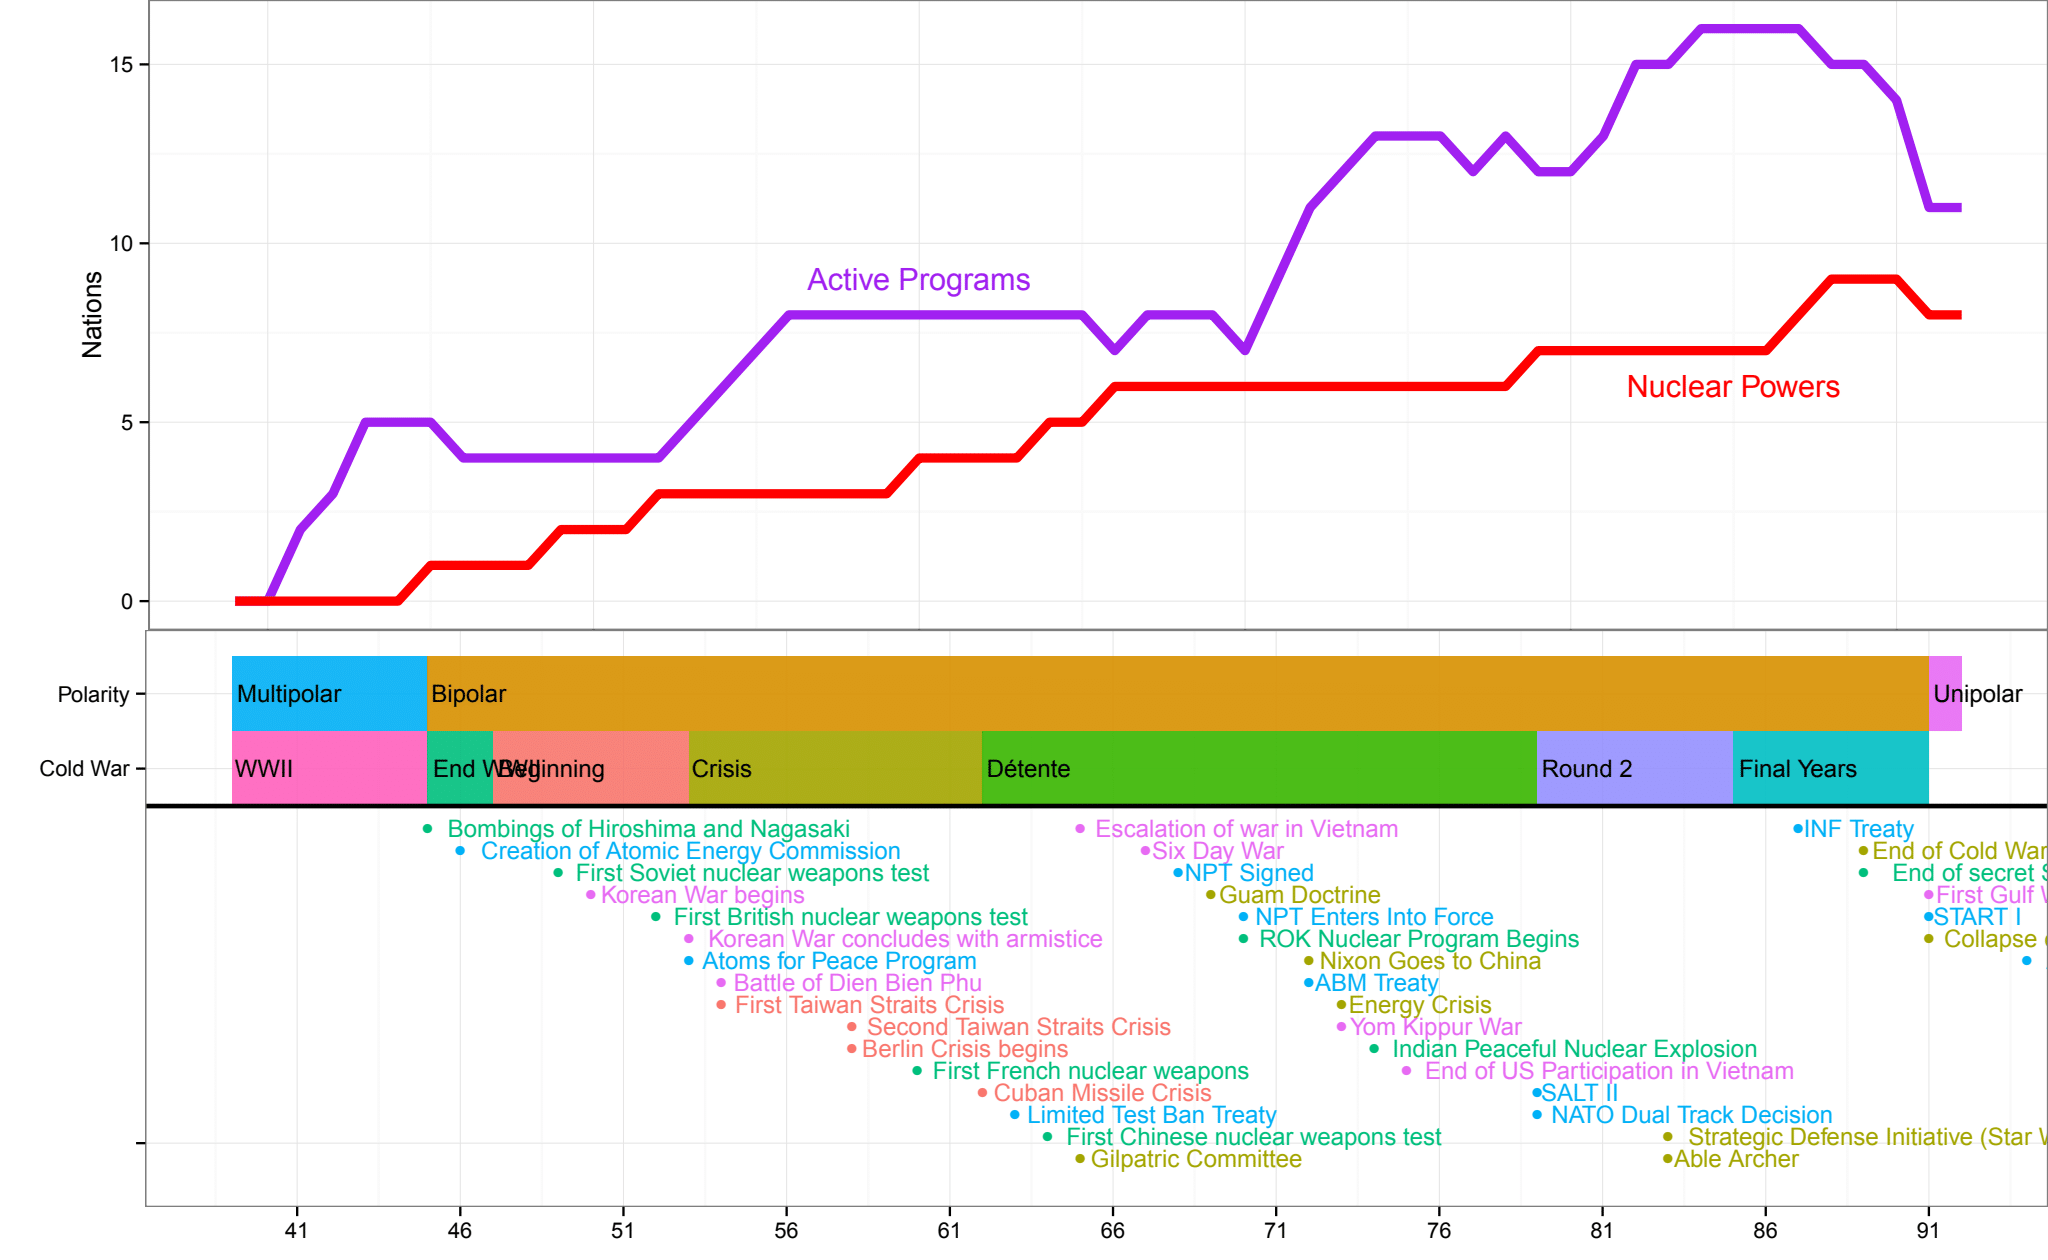

Result: Modeled nuclear weapons proliferation as a function of hundreds of common and novel features.
Method: (1) Harmonized dozens of open-source nuclear datasets into a single longitudinal panel (2) use custom random forest based metric of mutual information between variables (3) hiearchically cluster variables into shared conceptual meanings (4) model nuclear proflieration as a function of different conceptual aggregations.
Stack: Random Forest
22. Territorial Control in Civil War
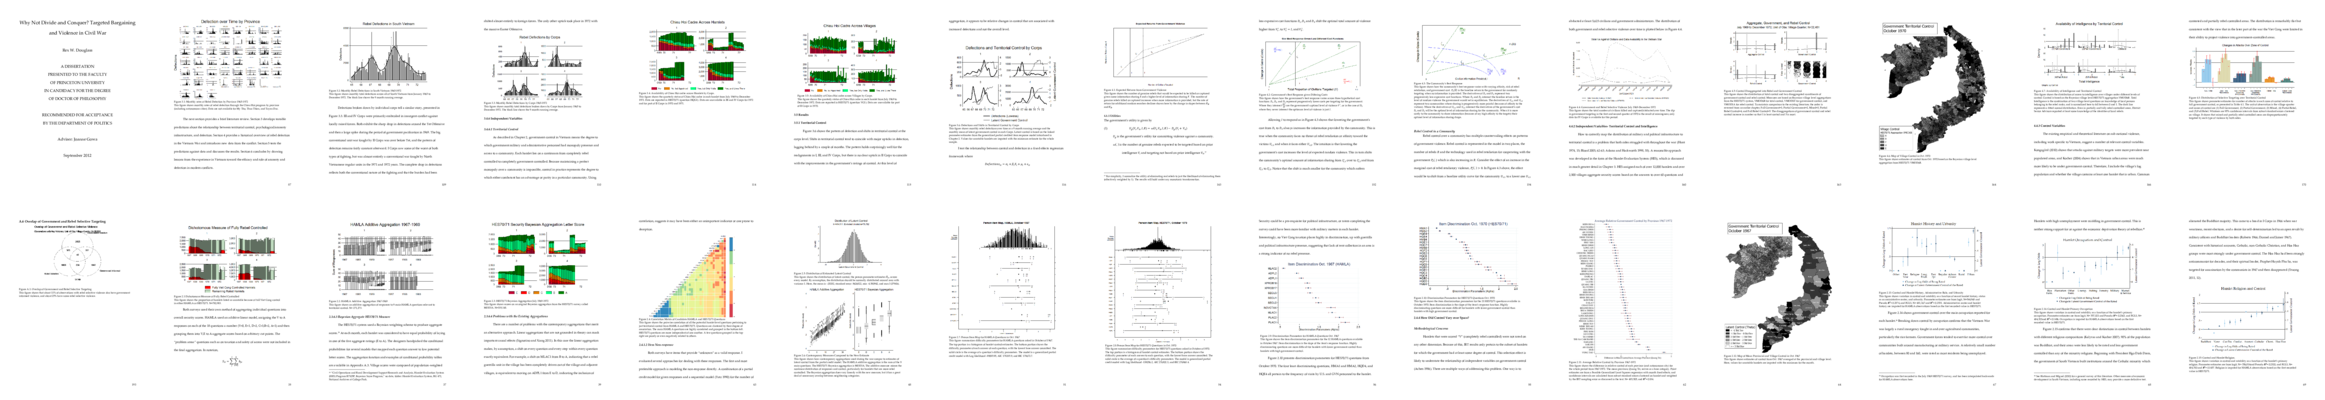
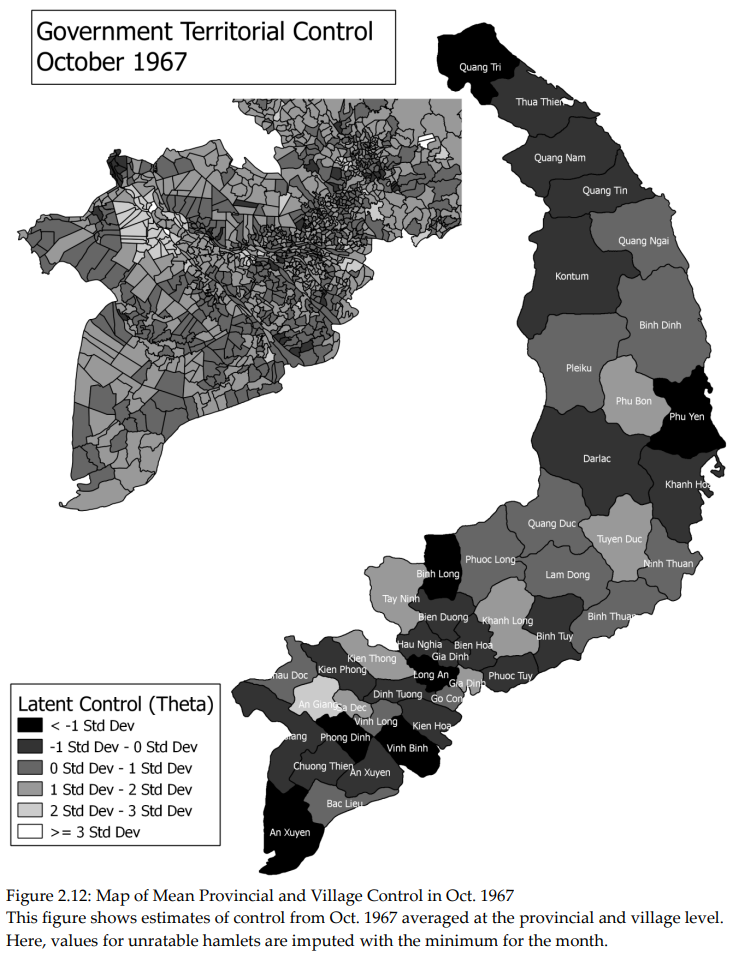
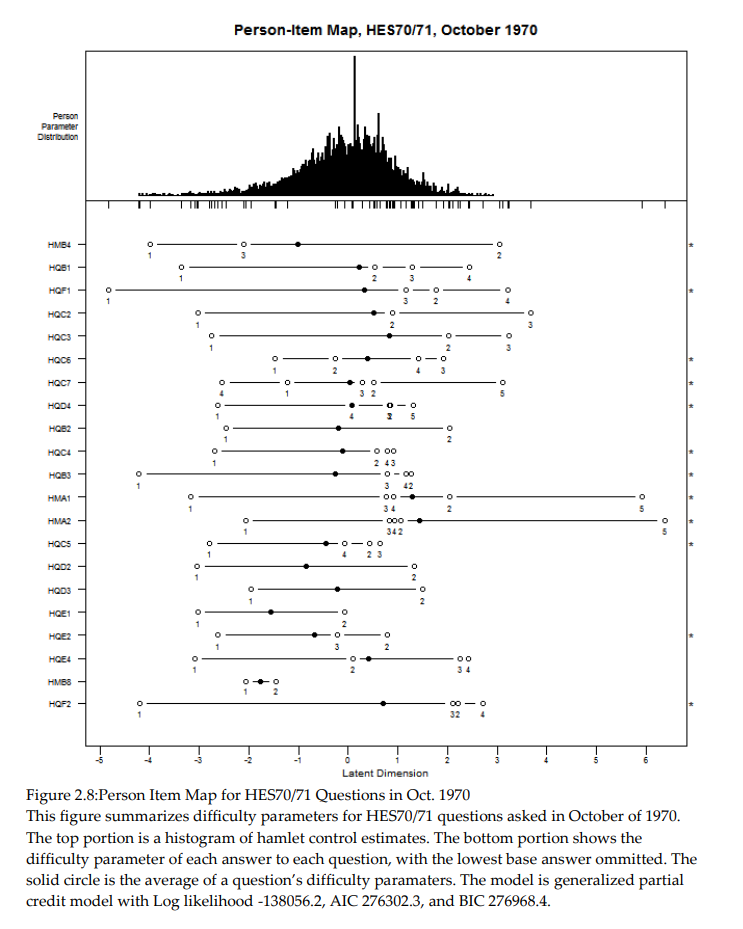
Result: My dissertation formalized how rebels trade control across space, pairing theory with microdata to explain when “divide and conquer” actually works.
Resources: Dissertation
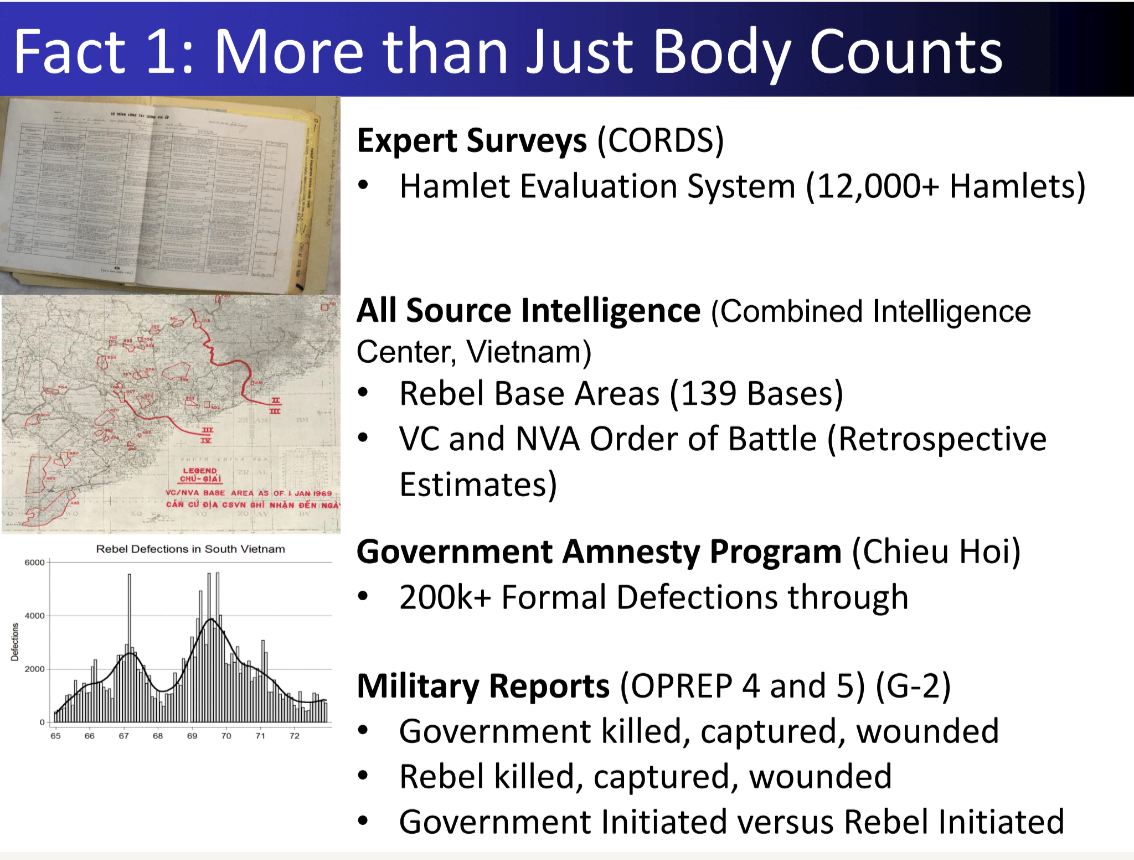
23. ML for Military Intelligence
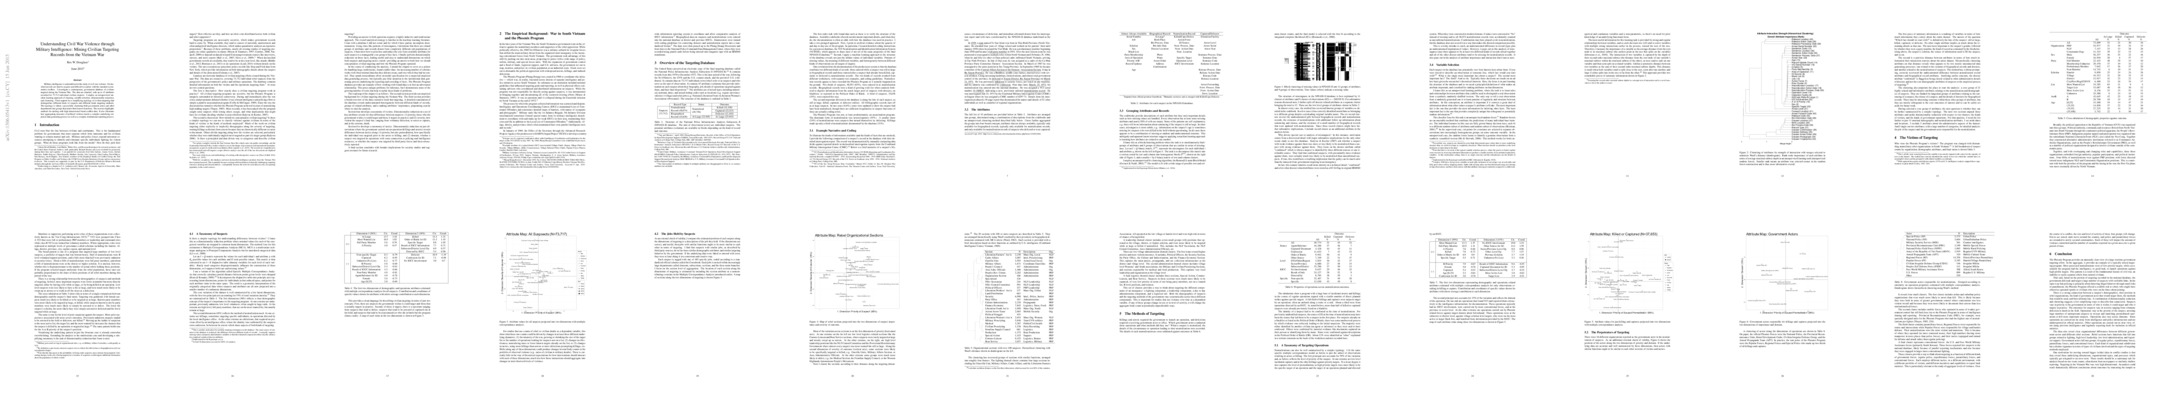
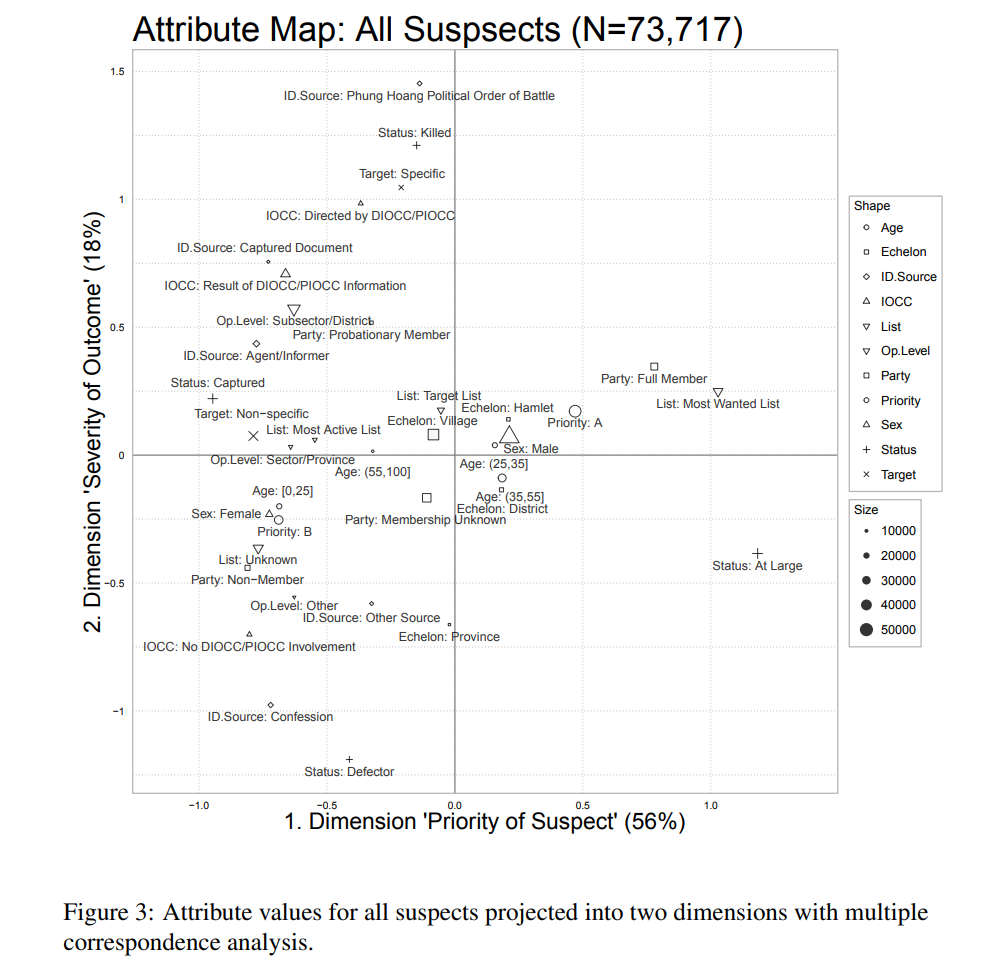
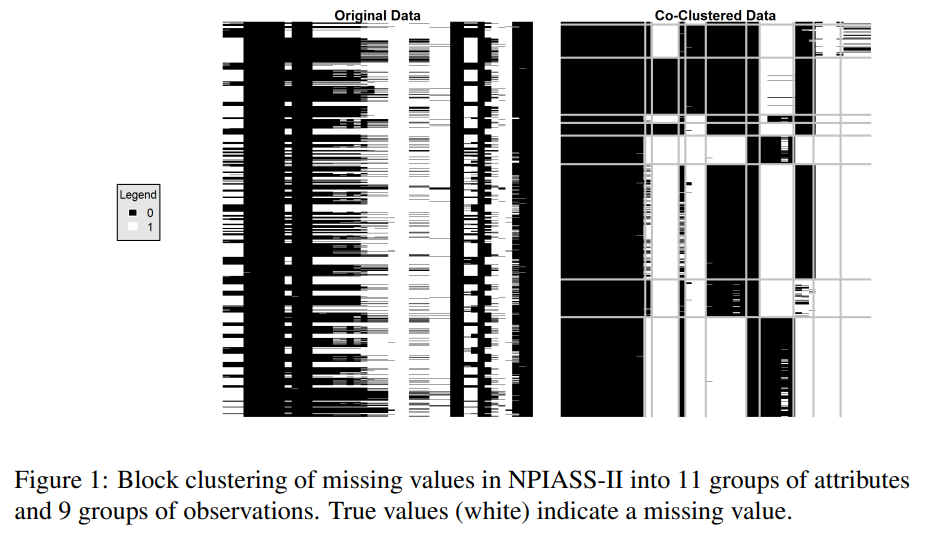
Result: Mined 73,712 Phoenix Program files to surface targeting patterns, building an unsupervised workflow that separated intelligence bias from battlefield reality.
Method: (1) Hiearchically cluster poorly documented features using a custom random forest based measure of variable importance (2) bicluster features further based on joint missingness (3) reduce dimensionality using multiepl correspondence analysis (4) hiearchically cluster suspects and organizations based on embeddings.
Stack: Multilpe Correspondence Analysis · Random Forest · Biclustering
Resources: “Understanding Civil War Violence through Military Intelligence: Mining Civilian Targeting Records from the Vietnam War” Chapter in C.A. Anderton and J. Brauer, eds., Economic Aspects of Genocides, Mass Atrocities, and Their Prevention. New York: Oxford University Press, 2016 [Ungated arXiv preprint]
24. Militarily Critical Technologies
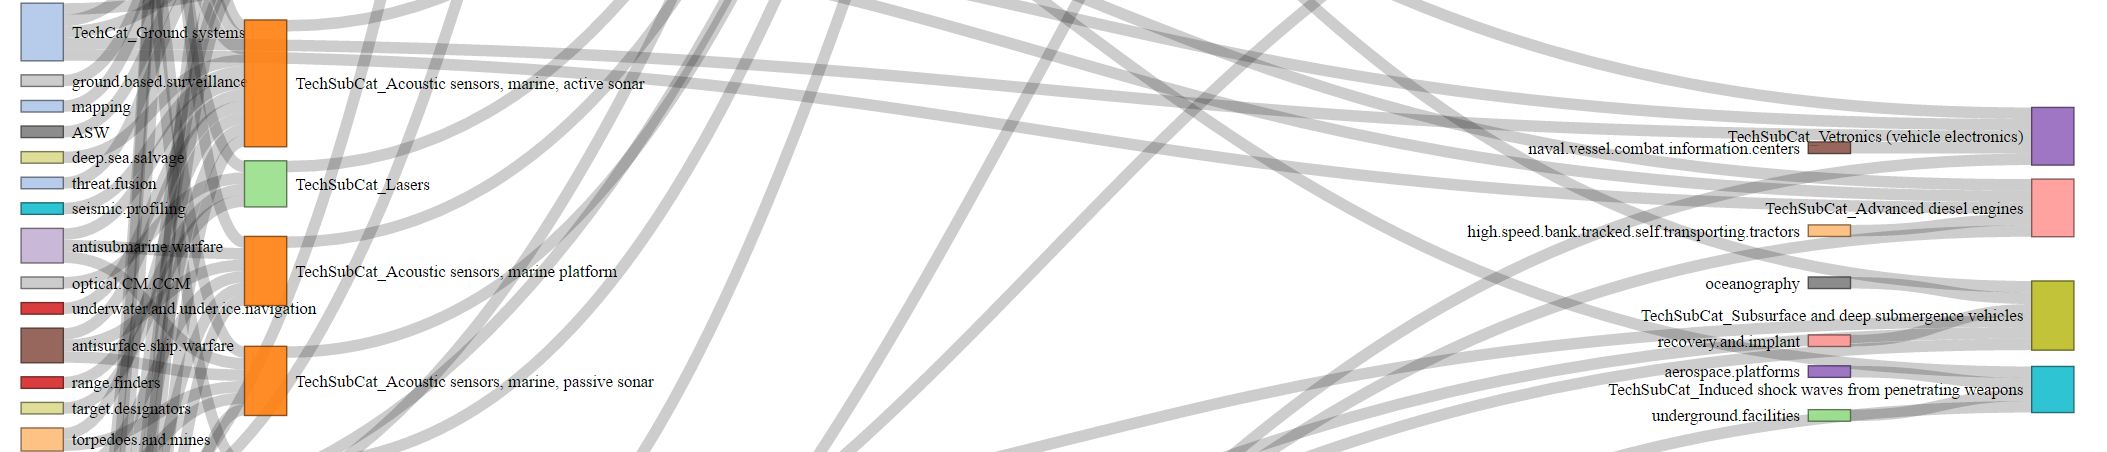
Result: Estimated the latent difficult of developing military technologies using surveys of global technology diffusion.
Method: (1) Estimate two parameter Item Response Model as a function of different military technologies and which countries have which combinations of them.
Stack: Keras
25. Learning Hierarchy
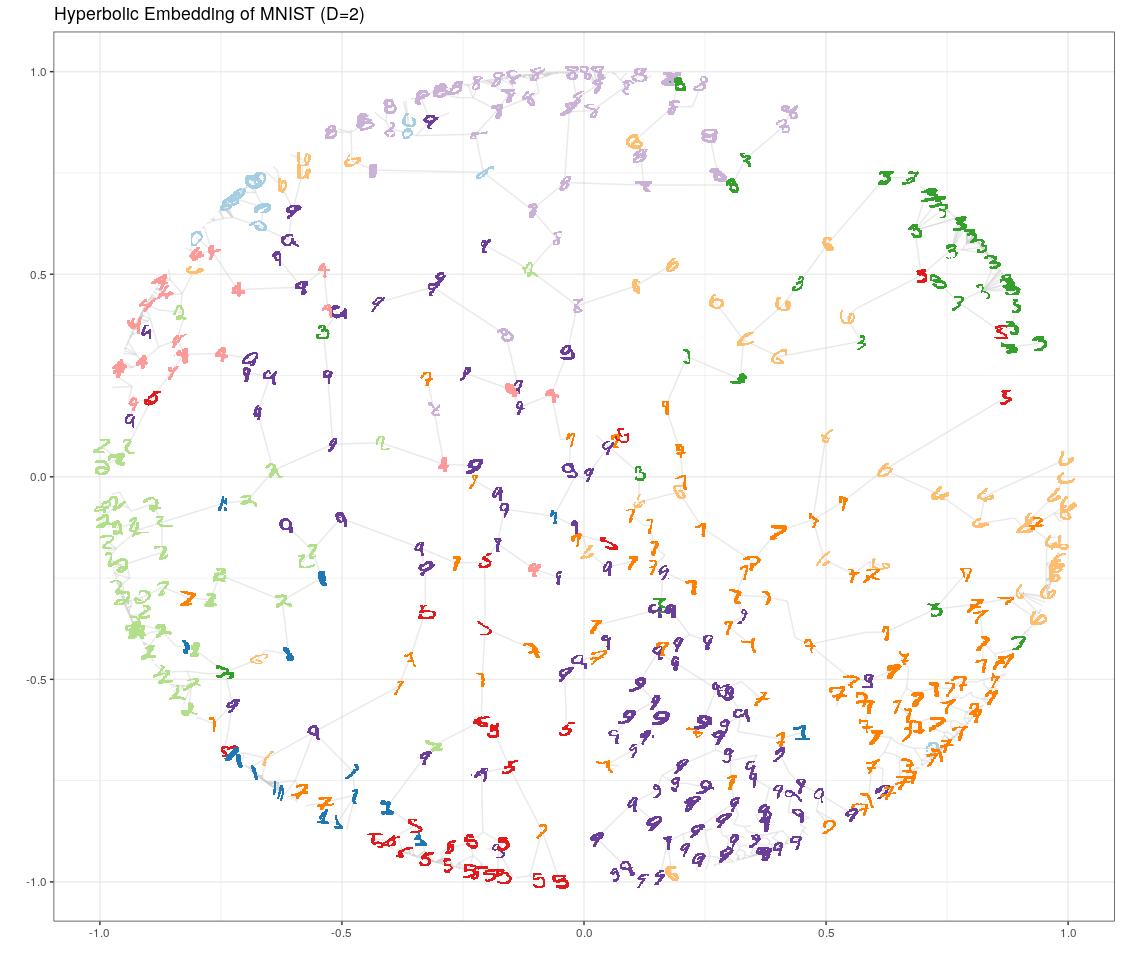
Result: Illustrated the meaning of hyperpbolic embeddings using the well known MNIST digits and an autoencoder with hyperbolic emedding layer.
Stack: Keras
26. mTurk Survey Experiment
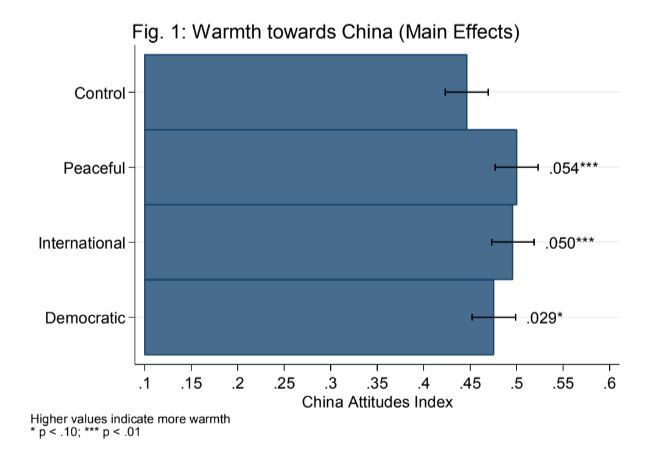
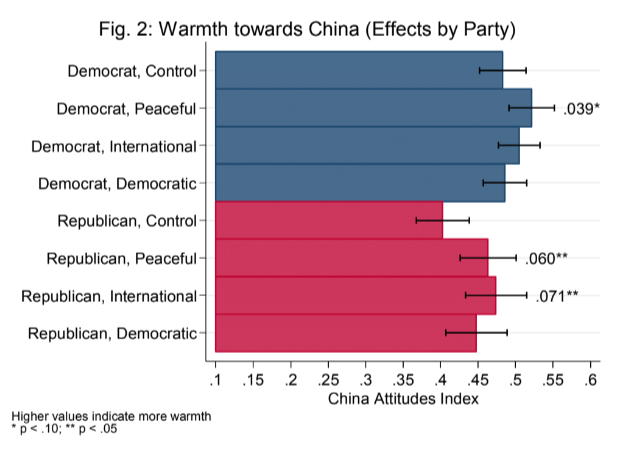
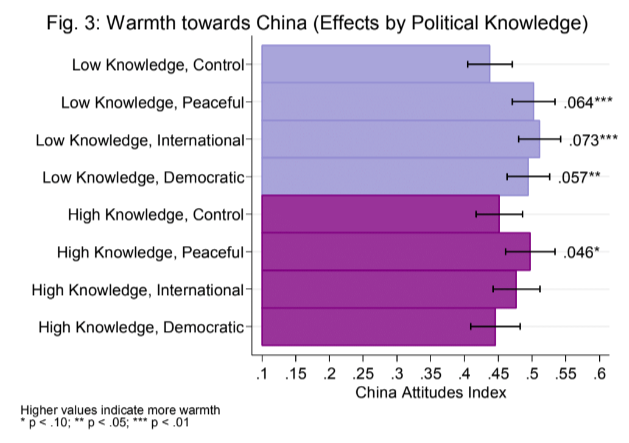


Result: Fielded a survey experiment with randomized vignetts estimating U.S. opinions towards China as a function of a control, news of peaceful behavior, news of warlike behavior, and news of democratic reforms.
Stack: Mechanical Turk
27. Measurement Vietnam War
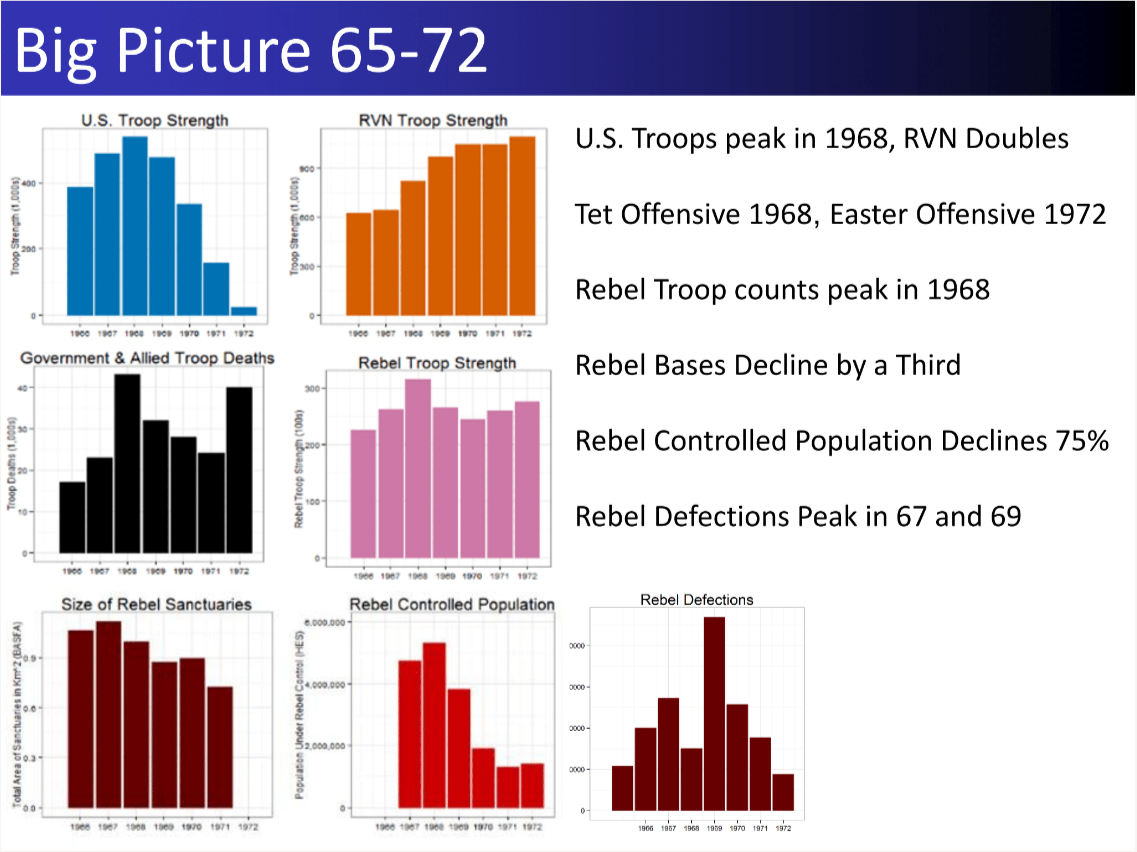
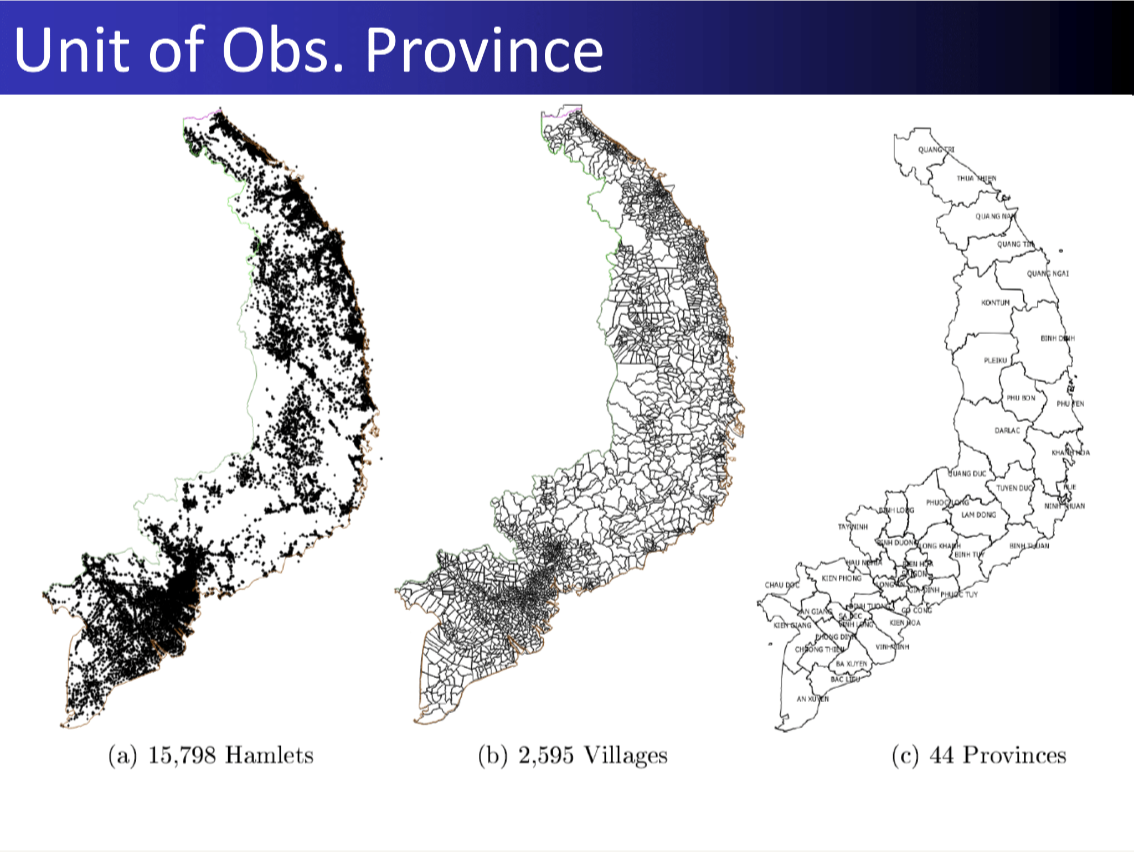
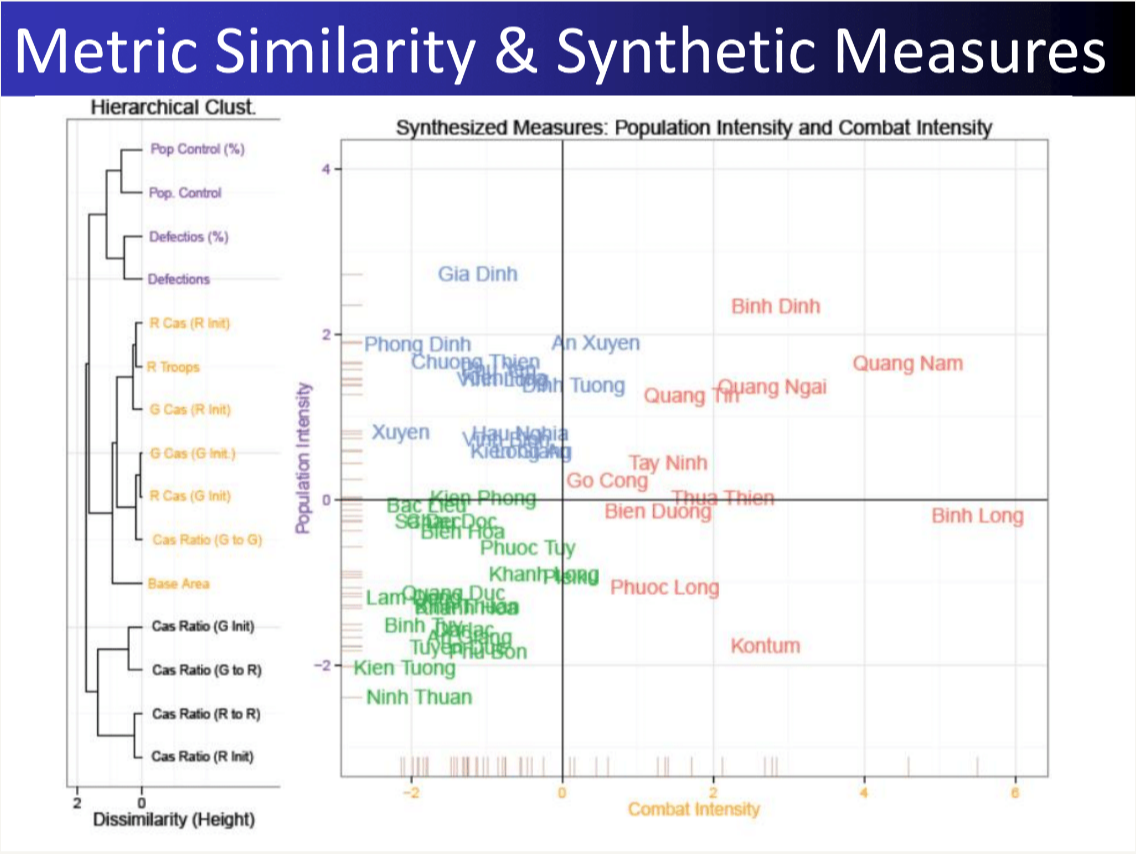
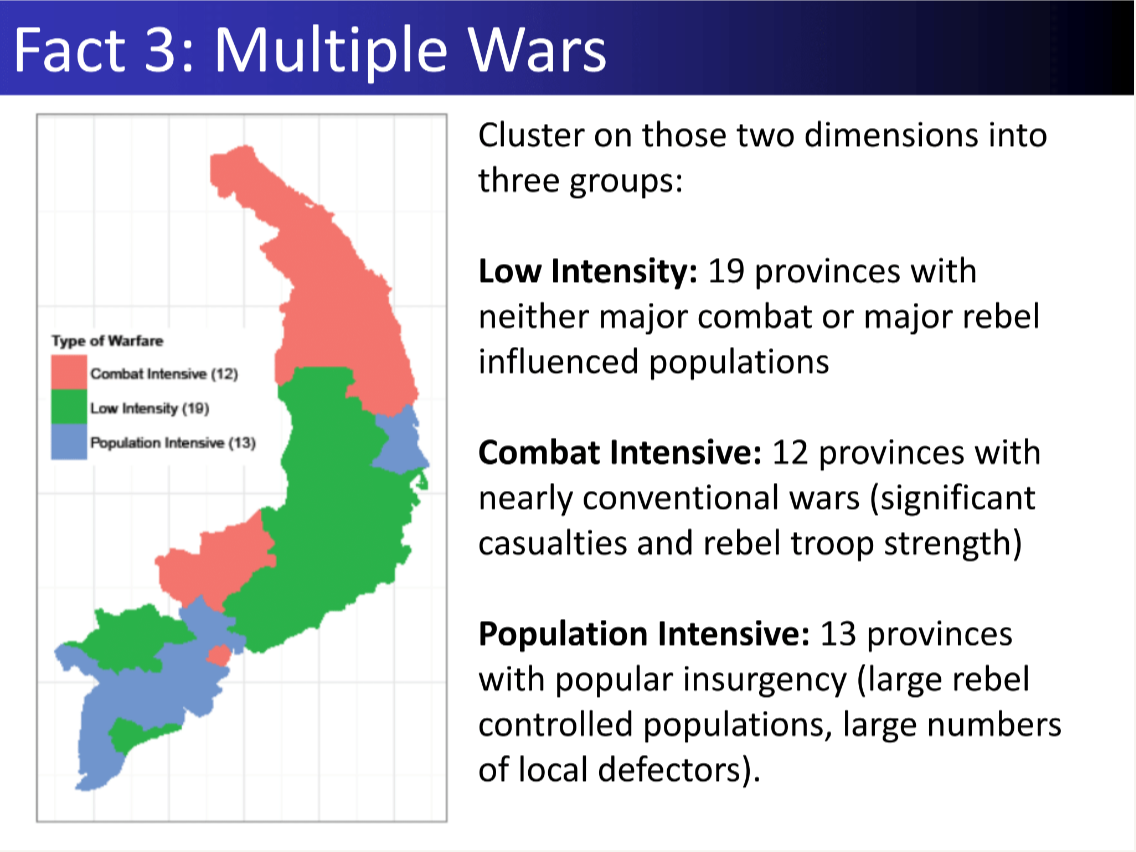
Result: Reconciled conflicting Vietnam War datasets to quantify civilian harm, revealing how different intelligence feeds tell different stories.
28. Robot for Digitizing Home Photos
Result: Designed and built a robot to digitize fragile photos without using a feed mechanism. Digitized over 60k+ home photos in a weekend.
Stack: C++ Micro-controller libraries
Resources: YouTube demo
Machine Learning Mini-Course
I taught a brief introduction to machine learning for new lab members and invited workshops, using the shared repo for exercises and slides.
Resources: Course materials on GitHub