I am an applied scientist specializing in measurement, inference, and machine learning.
I work on big, dirty, unstructured, observational data. Examples include, cell phone calls, military intelligence, text from scientific articles, knowledge bases like wikidata, newspaper reports, and raw natural images. Here below are some example projects that have emerged from that work.
You can find me at @RexDouglass ; Github ; LinkedIn
―Text―
1 Events from Historical Narratives
We introduce the first high coverage, high recall, AND high precision international conflict database. International Crisis Behaviors Events (ICBe) is a human coded event dataset of 10k+ international events, covering 117+ behaviors, across 475 international Crises (1918-2015).
Website: CrisisEvents.org | Github | Paper | Appendix | Codebook | Twitter
“Introducing the ICBe Dataset: Very High Recall and Precision Event Extraction from Narratives about International Crises.” (with Thomas Leo Scherer, J. Andrés Gannon, Erik Gartzke, Jon Lindsay, Shannon Carcelli, Jonathan Wiklenfeld, David M. Quinn, Catherine Aiken, Jose Miguel Cabezas Navarro, Neil Lund, Egle Murauskaite, and Diana Partridge). 2022. arXiv:2202.07081.
1.1 Machine Readable Event Summaries from Natural Language Text
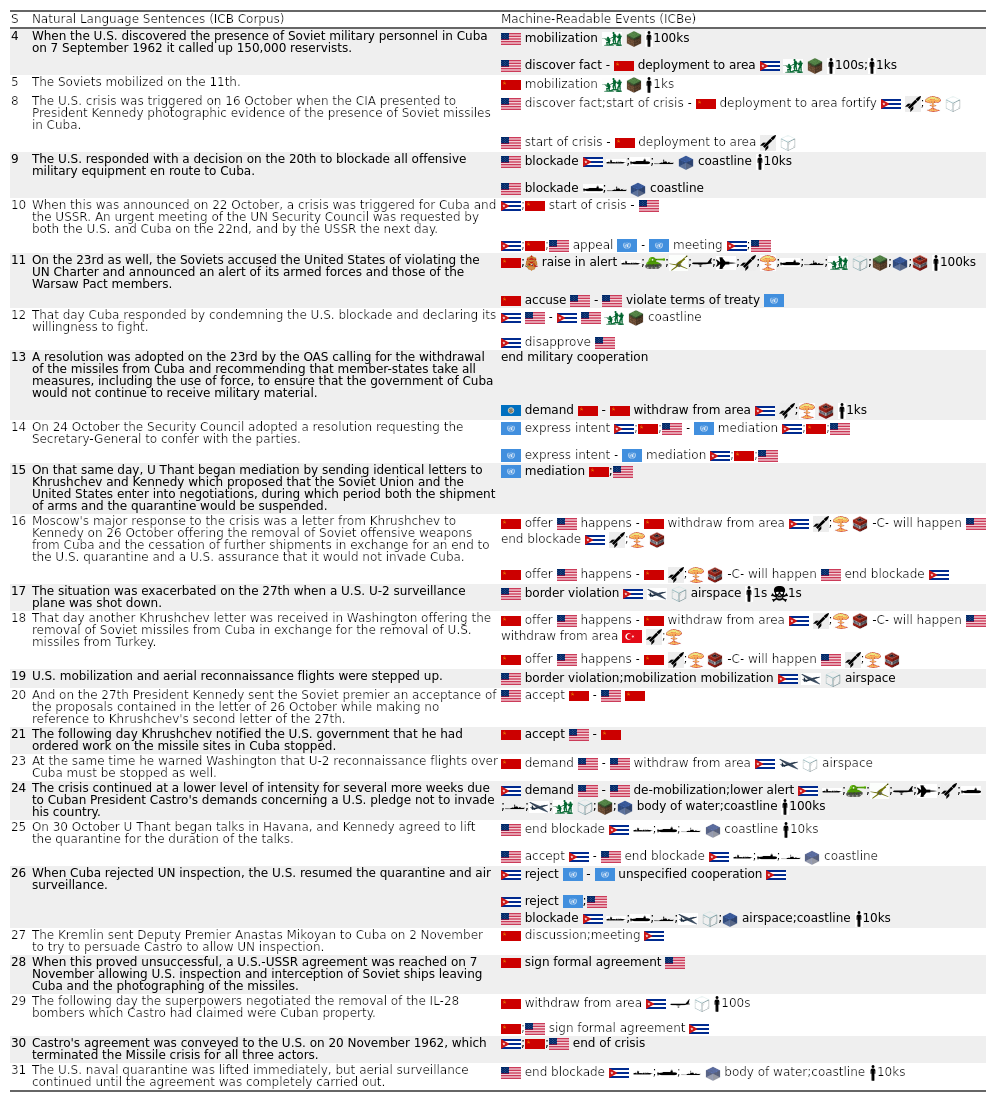
How do we perform statistics on history when it’s locked in unstructured text?
We introduce a measurement system for turning text into machine readable events.
This example from the Cuban Missile Crisis (1962) shows how our ontology applied by human coders turns each sentence into one or more explicit interactions.
1.2 State of the art Event Ontology
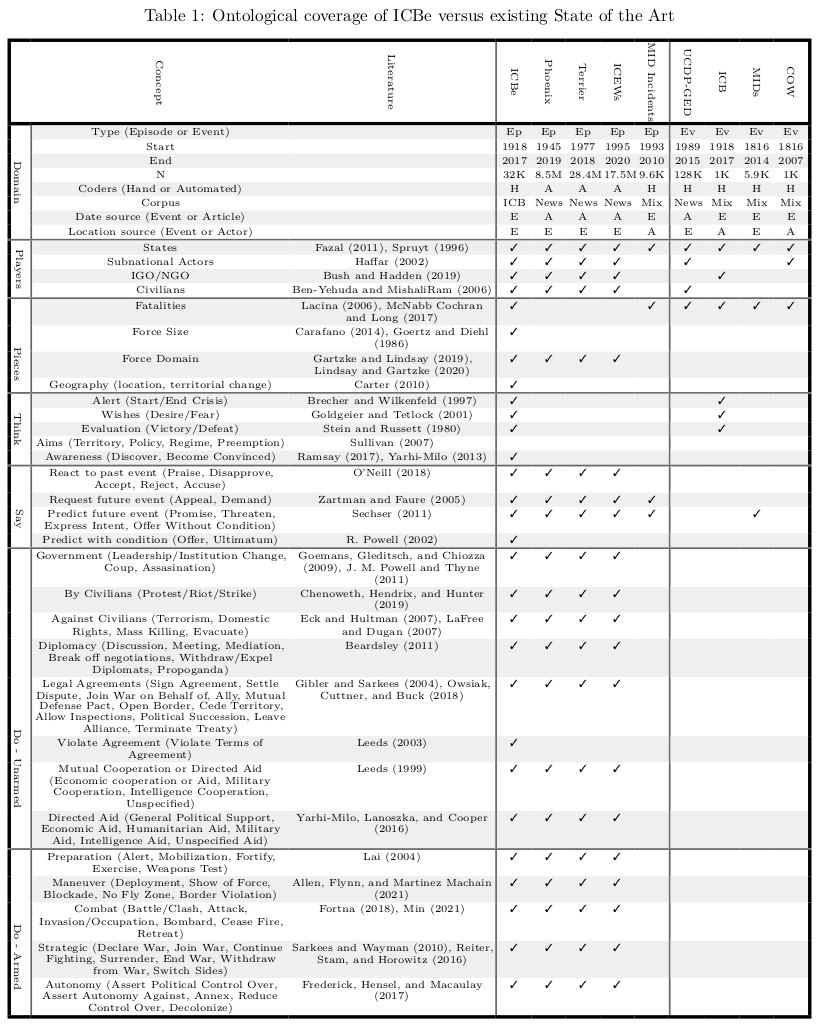
We had to develop an ontology from scratch which could capture all of unique information found in international interactions.
1.3 Dealing with Coder Fatigue with an Adaptive Hierarchical User Interface
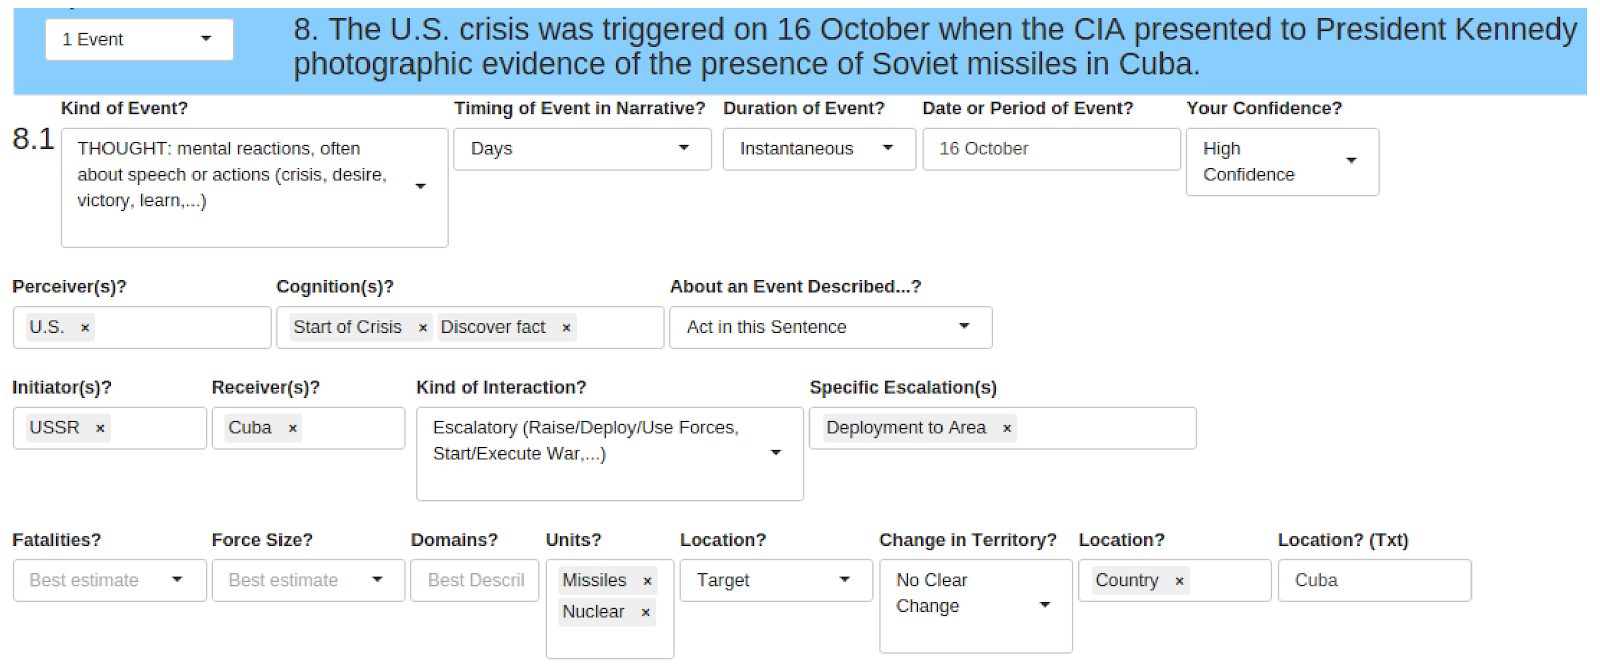
The downside of a large ontology is coder fatigue.
Our solution was an interactive GUI that presented questions only as they became relevant based on previous answers.
1.4 How to Measure Recall on Events with Fractal Levels of Detail
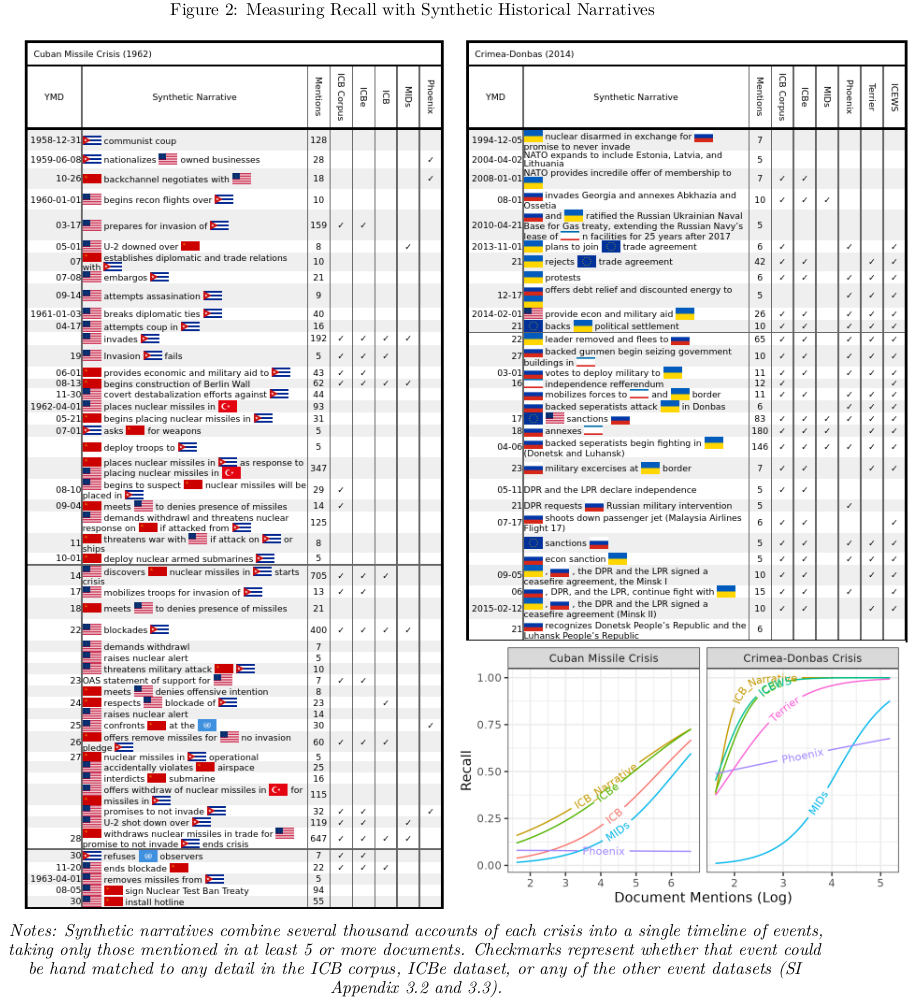
History suffers from the Coastline paradox- the more you zoom in the more events you find between any two other events. Should a dataset be rewarded for including trivial unimportant details or penalized for excluding them? What makes an event important or trivial?
We propose measuring importance as the number of times an event is mentioned across secondary accounts. Events which are chosen more often by more authors across more contexts, have a higher latent intrinsic importance to that historical episode than those that are rarely mentioned or mentioned only under specific contexts.
We introduce the Synthetic Historical Narrative which is the tally of all events mentioned in a large corpus of documents. We construct the event list by parsing texts into sentences and then clustering sentences by semantic similarity using a large language model fine tuned for paraphrase detection (mpnet).
Recall curves are then calculated for each dataset by log of mentions of each event.
2 Visualizing Complex Narratives over Time
crisisevents.org (with Thomas Leo Scherer)
A web portal for visualizing and comparing event data. We introduce a new visualization called a crisis-map, which is a combination of a timeline and a directed network graph for displaying complex interactions between actors over time.
2.1 Visualizing Event-Network Timelines
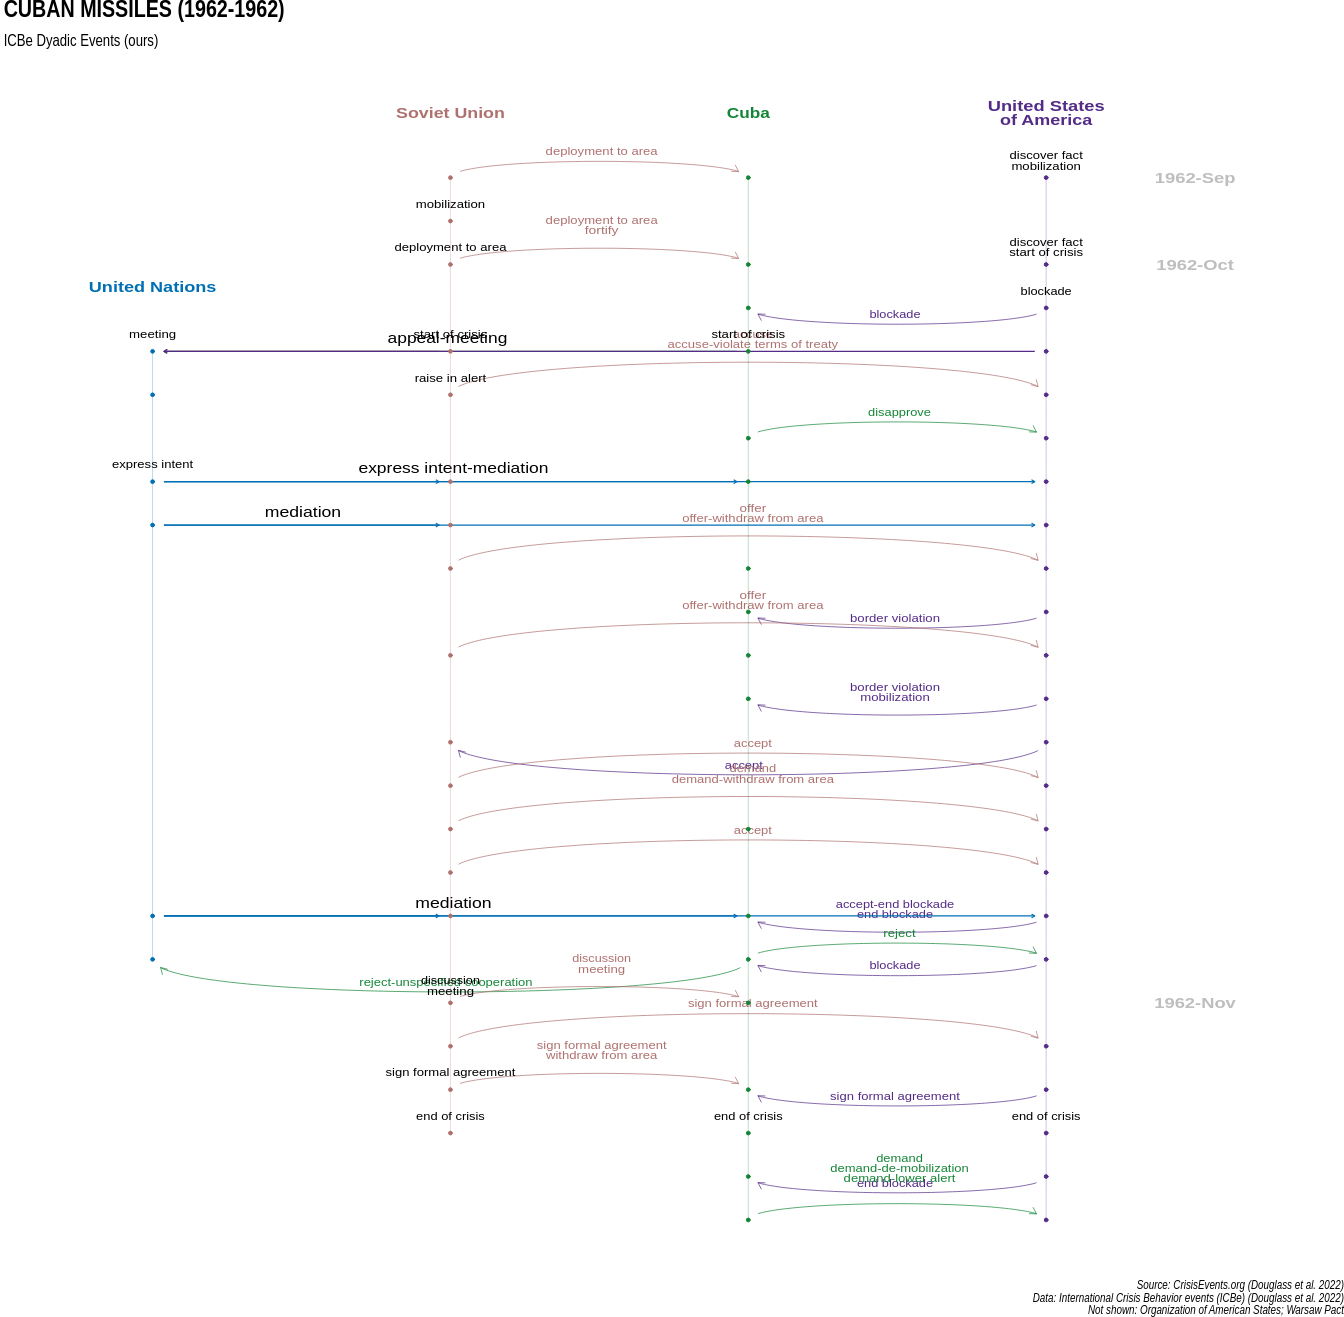
Multi-dimensional graphs that evolve over time are difficult to visualize. We introduce a crisis-map, which shows actors on individual timelines, with points representing unilateral events, and edges representing directed actions.
3 Topic Models for Research Papers
We applied topic modeling to a unique corpus of 3,000 expert curated articles on violent extremism and found unique patterns in methods employed, countries studied, and citation networks.
“MINING THE GAPS: A Text Mining-Based Meta-Analysis of the Current State of Research on Violent Extremism” (with Candace Rondeaux) [Ungated PDF]
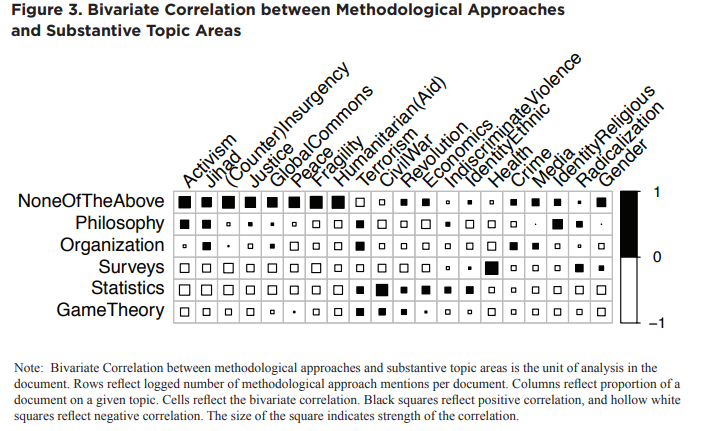
3.1 Categorizing Methodological Tools Employed in Research
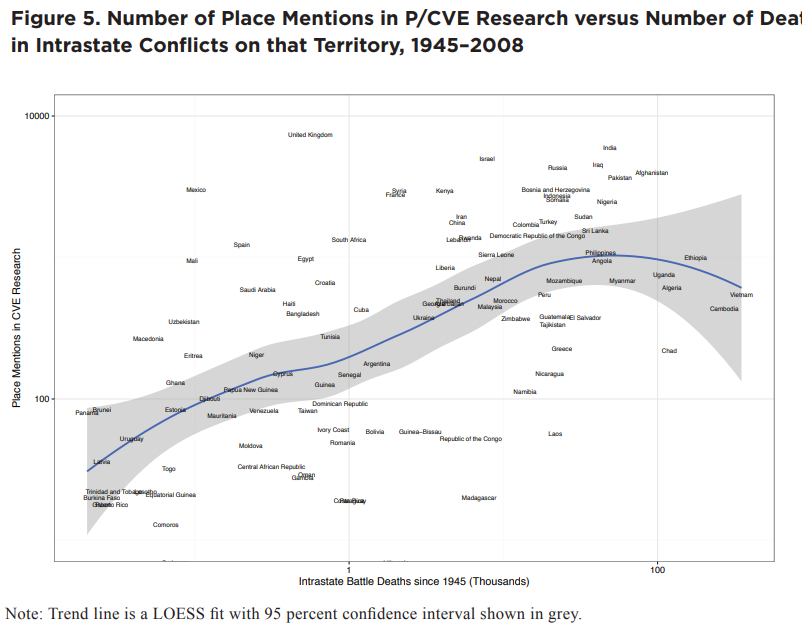
3.2 Comparing Amount of Research vs Deadliness of the Conflict
―COVID―
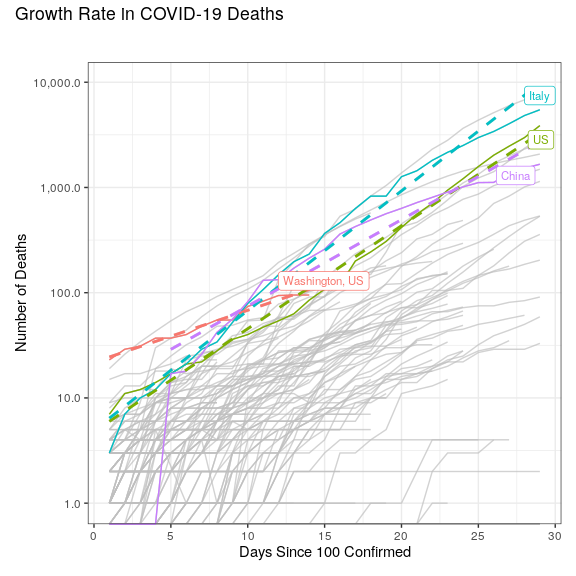
The Data Science of COVID-19 Spread: Some Troubling Current and Future Trends (with Thomas Scherer, Erik Gartzke), Peace Economics, Peace Science and Public Policy, August 17, 2020
[Paper] [Paper Open Access] [Media: Wired] [Media: Slate] [Media: king5]
Replication of ‘Substantial underestimation of SARS-CoV-2 infection in the United States’ (We et al. 2020)]
I provide semi-regular review of COVID-19 papers and literature reviews on Twitter (30 and counting) in this [thread].
4 COVID-19 Vaccinations
4.1 COVID19 Vaccine Uptake
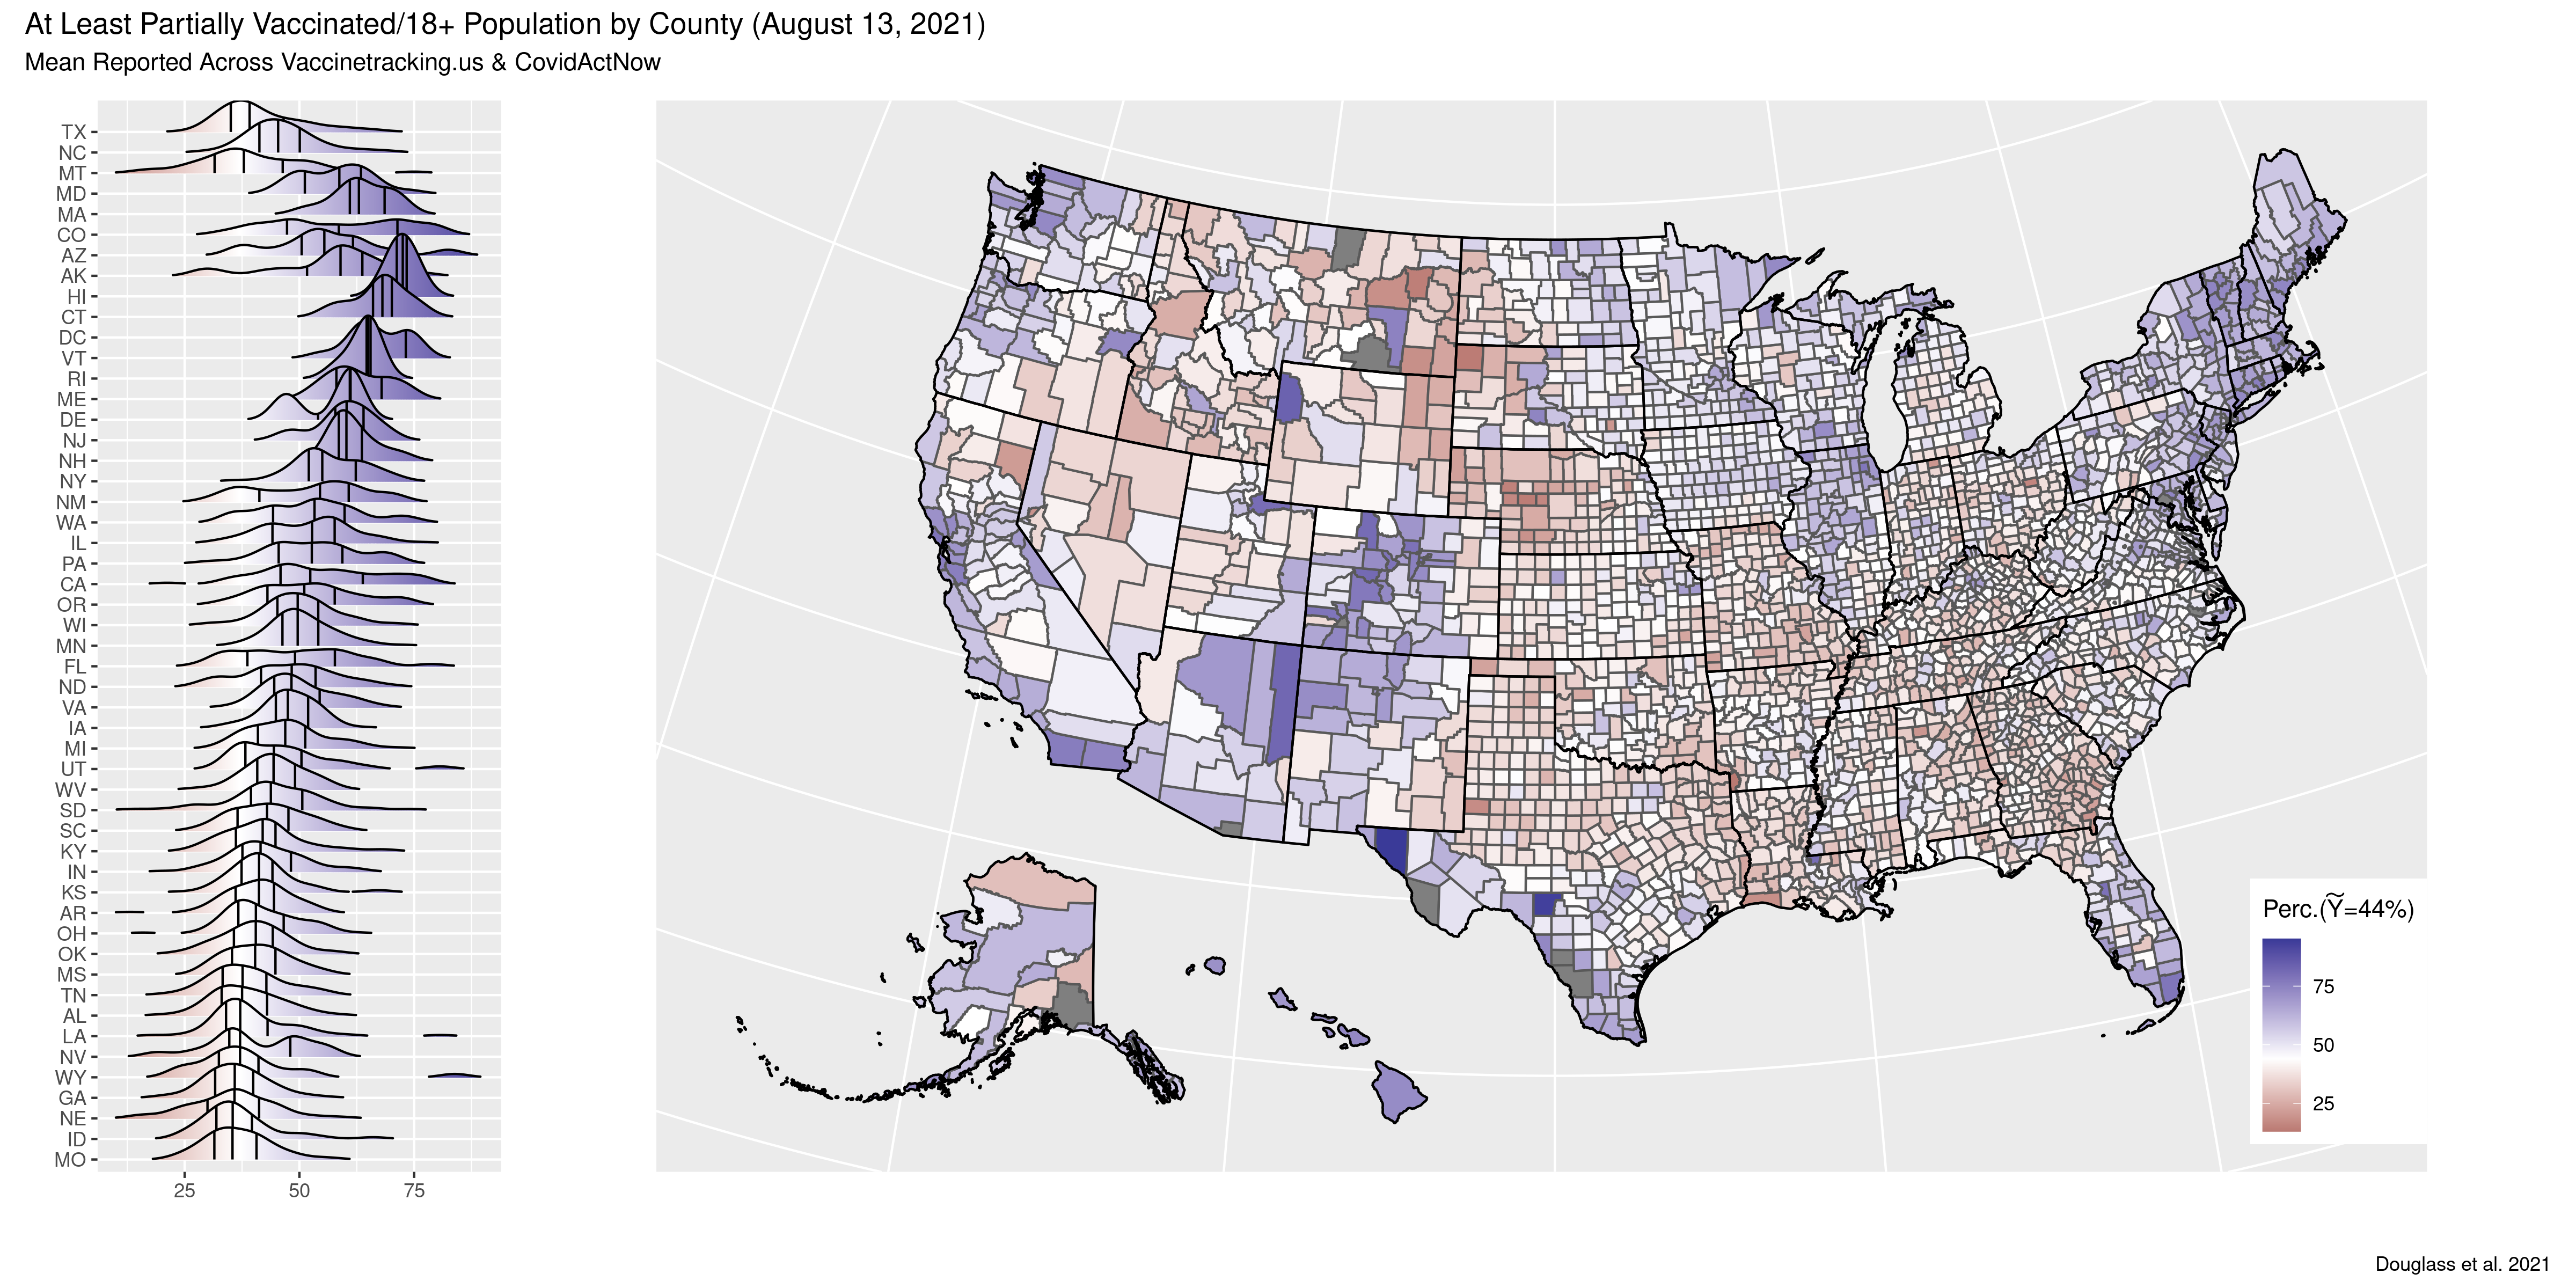
Why do COVID19 vaccination rates vary so substantially across and within states?
In some counties vaccination rates are over 75% while in others they’re less than 25%.
4.2 Modeling Tens of Thousand of Features but with only Thousands of Rows
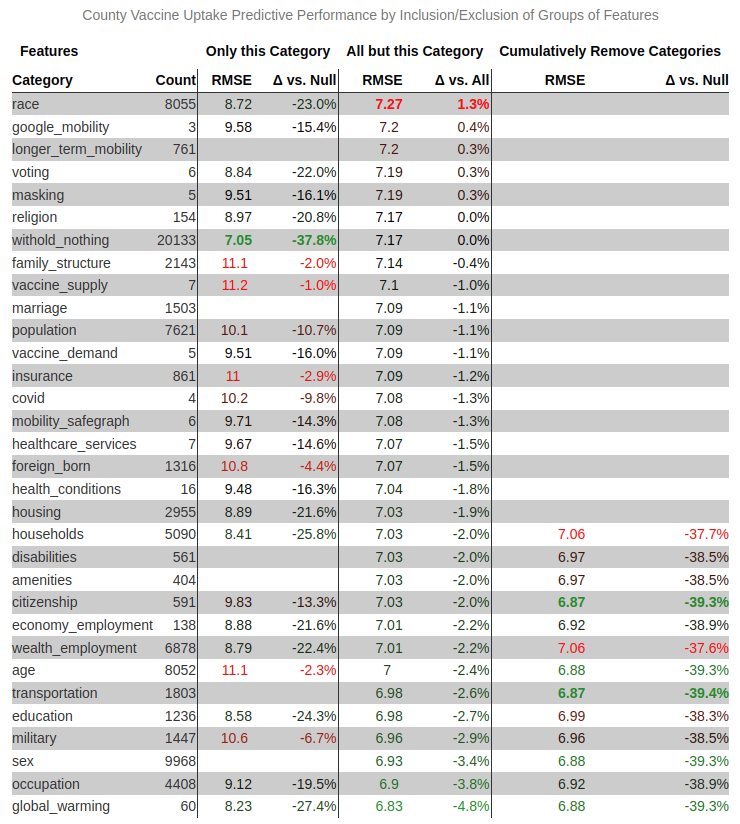
A lot of information is available about U.S. counties - tens of thousands of possible features.
How do we meaningfully organize them into possible explainations and test their ability to predict vaccine uptake?
We employ Gradient Boosted Trees (LightGBM) with spatial-cross validation on features grouped by substantive topic.
We evaluate change in out of sample performance for (1) only that topic, (2) everything but that topic, and (3) cumulatively removing topics from the best single fit.
For example attitudes about global warming (last row) are individually highly predictive (reduce RMSE by 27.4%), but badly overfit (removing from full ensemble reduces RMSE by 4.8%). 10 groups can be removed without hurting performance.
4.3 Interpretable ML on Wide Data
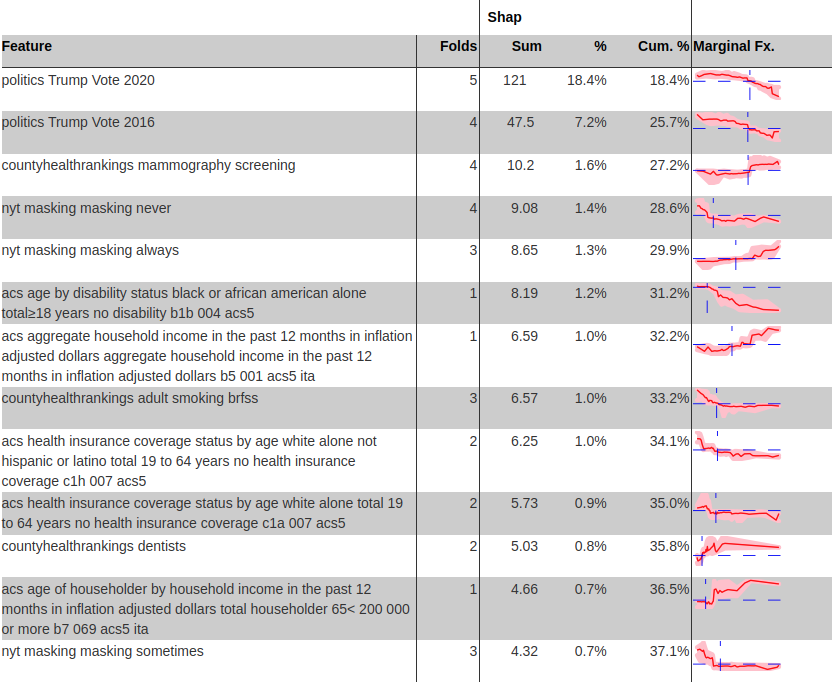
Given thousands of remaining features and a non-parametric GBT algorithm, how should we interpret individual features?
We rank order features by the percent of variance they explain (SHAP values), only on spatial-hold outs.
For example, the county’s percent vote for Trump in 2020 is the only feature chosen in all 5 spatial folds, and alone accounts for 18.4% of the variance.
A novel marginal effects plot shows the nonlinear relationship predicted for each feature relative to its mean and with confidence bands.
5 COVID-19 Infections
5.1 Estimates of True COVID19 Infections over Time
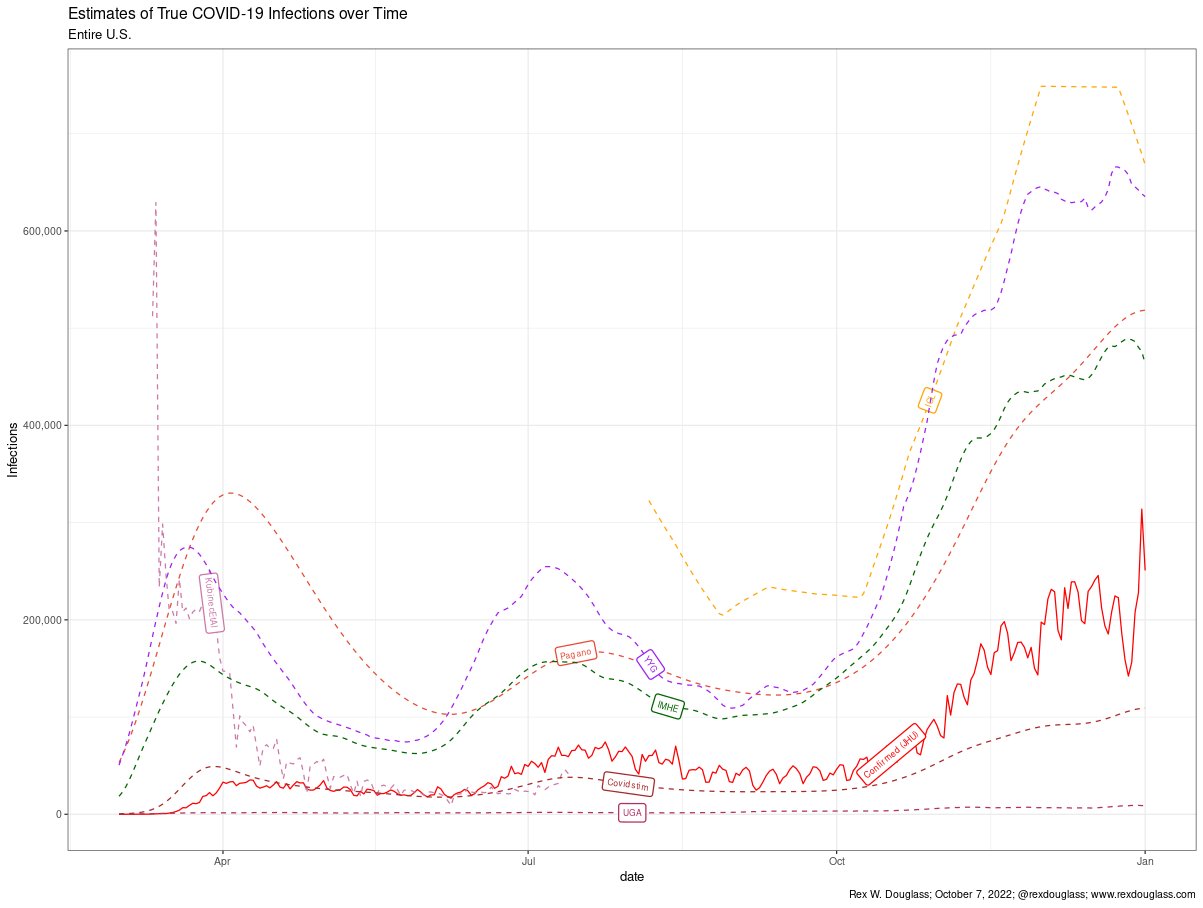
How many Americans were infected with COVID19 at each point in the pandemic?
The U.S. has no concrete direct measurement.
We collected every existing estimate, and they differ radically in magnitude and timing of infection waves.
5.2 A Better Bayesian Estimate combining Positivity, Wastewater, Seroprevelance, and PCR Tests
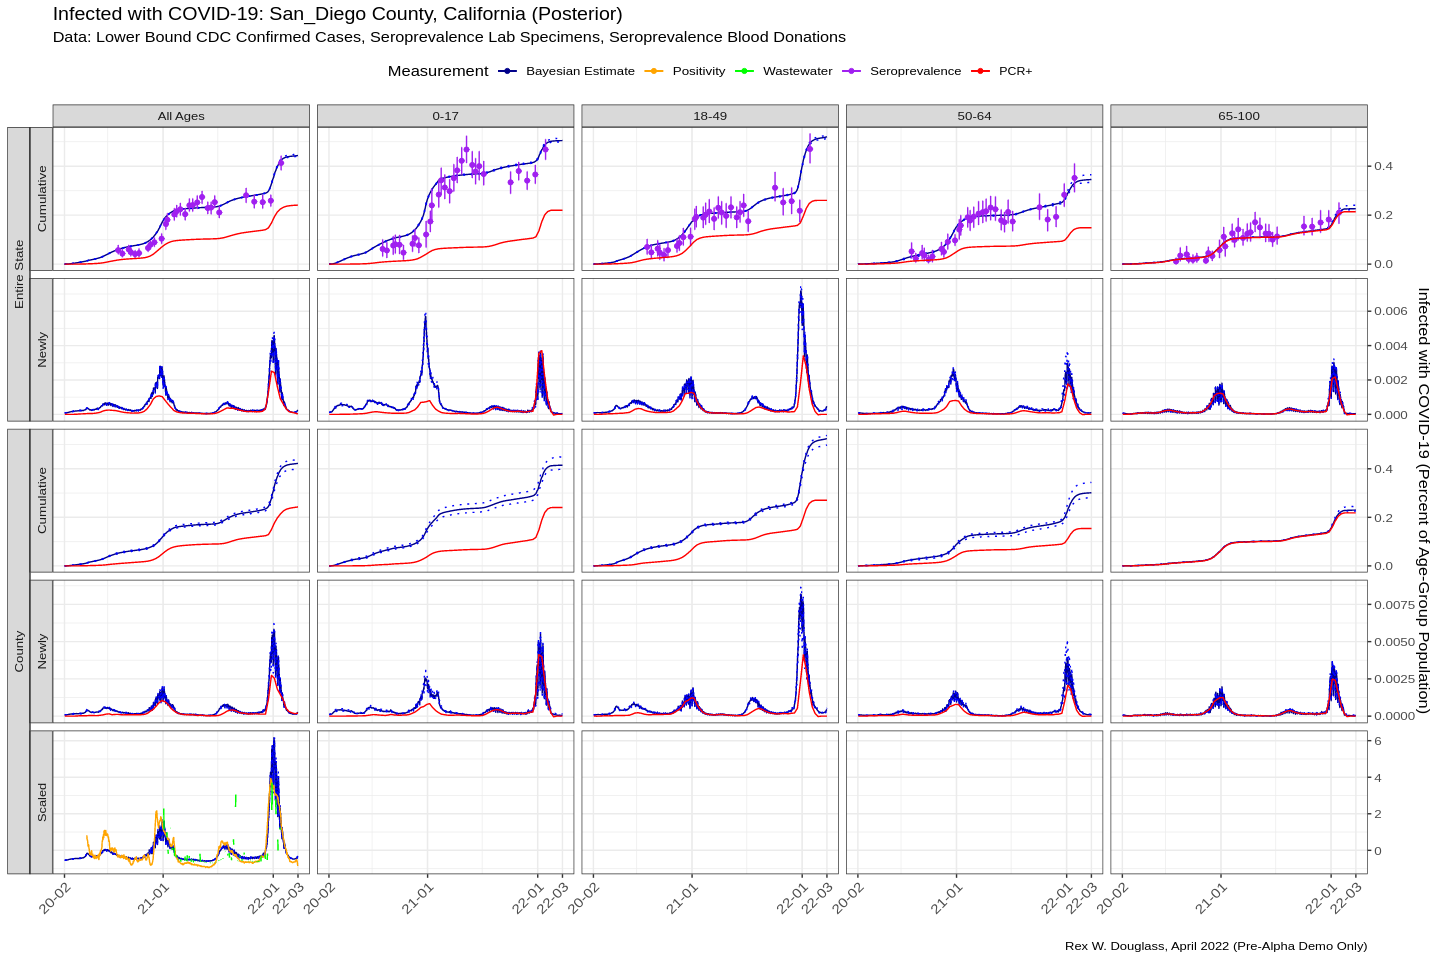
We treat true infections as a latent unobserved variable partial observed by different COVID19 signals.
Wastewater samples detect COVID19 shed in faeces and is an unbiased but relatively recent signal.
Positivity measures the ratio of positive PCR tests to total tests and provides a biased signal available sooner than wastewater.
Seroprevalence Surveys measure the percent of blood donations with antibodies from COVID19 infections, but are infrequent and not available at the county level.
PCR+ Tests provide a hard lower bound on minimum number of true infections.
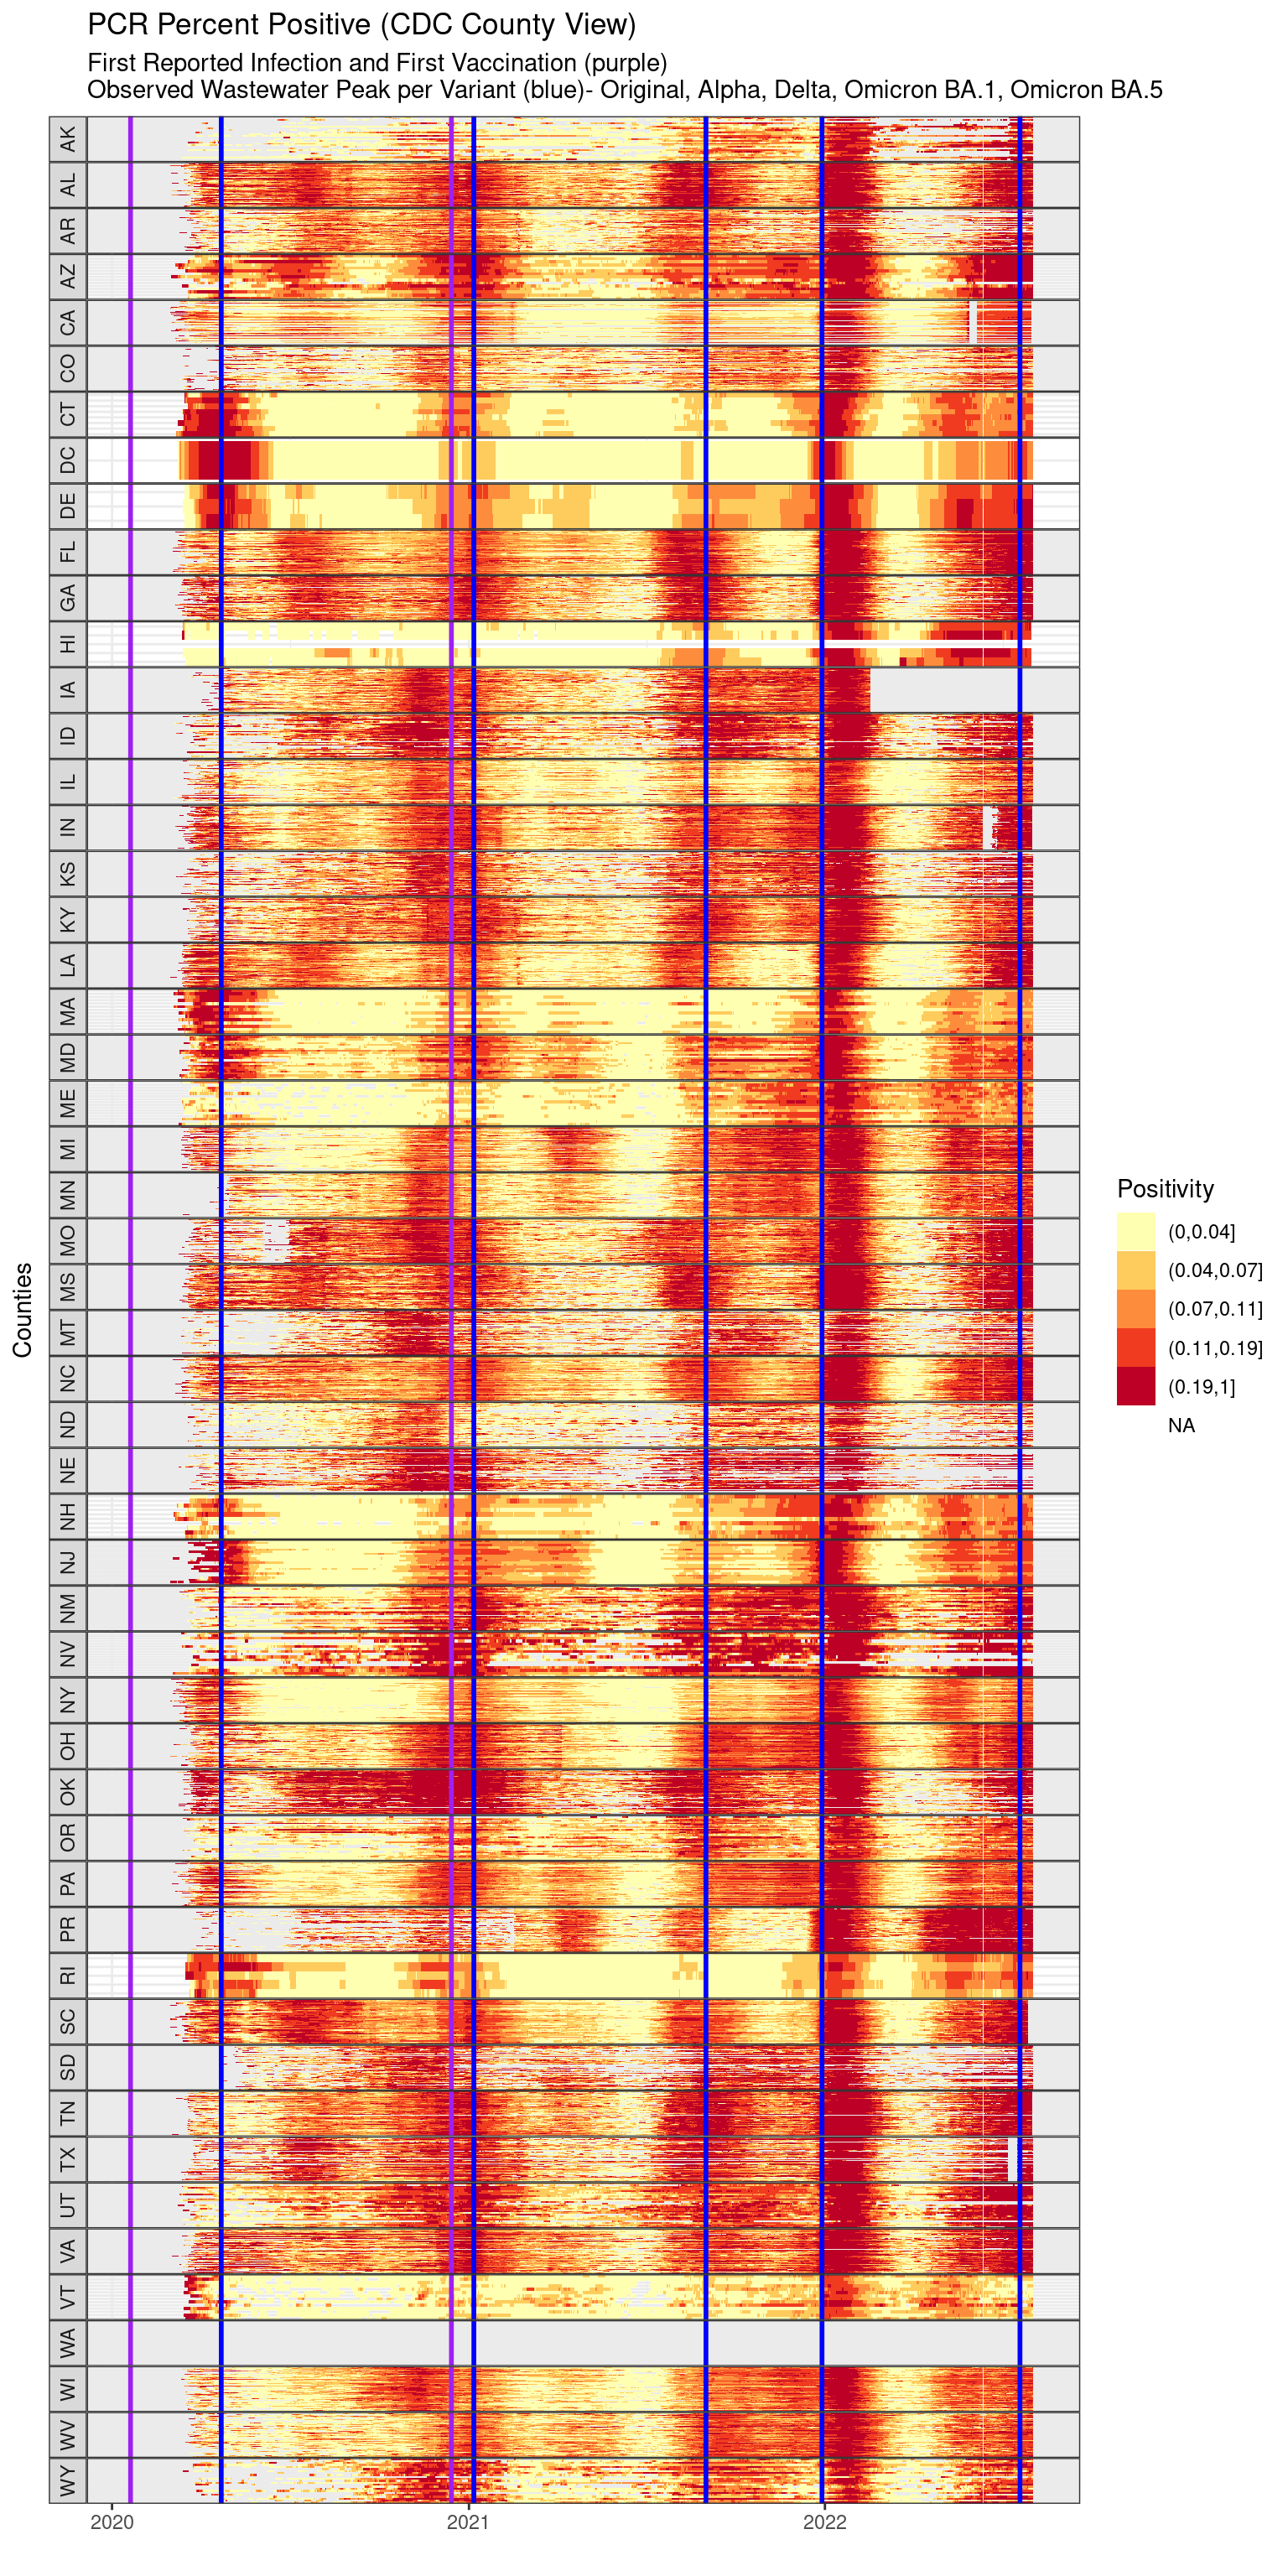
5.3 Careful clearning of dirty U.S. COVID19 Surveillance Data
6 COVID-19 Deaths
How to be Curious Instead of Contrarian About COVID-19: Eight Data Science Lessons From ‘Coronavirus Perspective’ (Epstein 2020), March 30, 2020
―Networks―
7 Population from Phone Calls
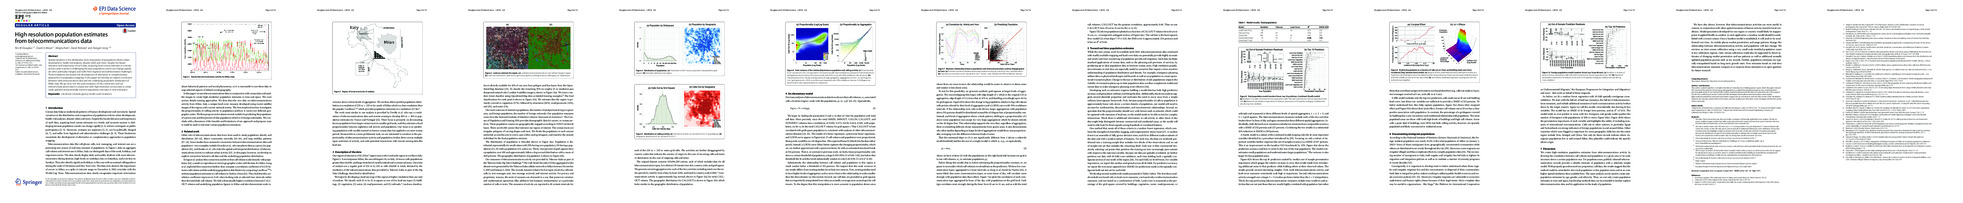
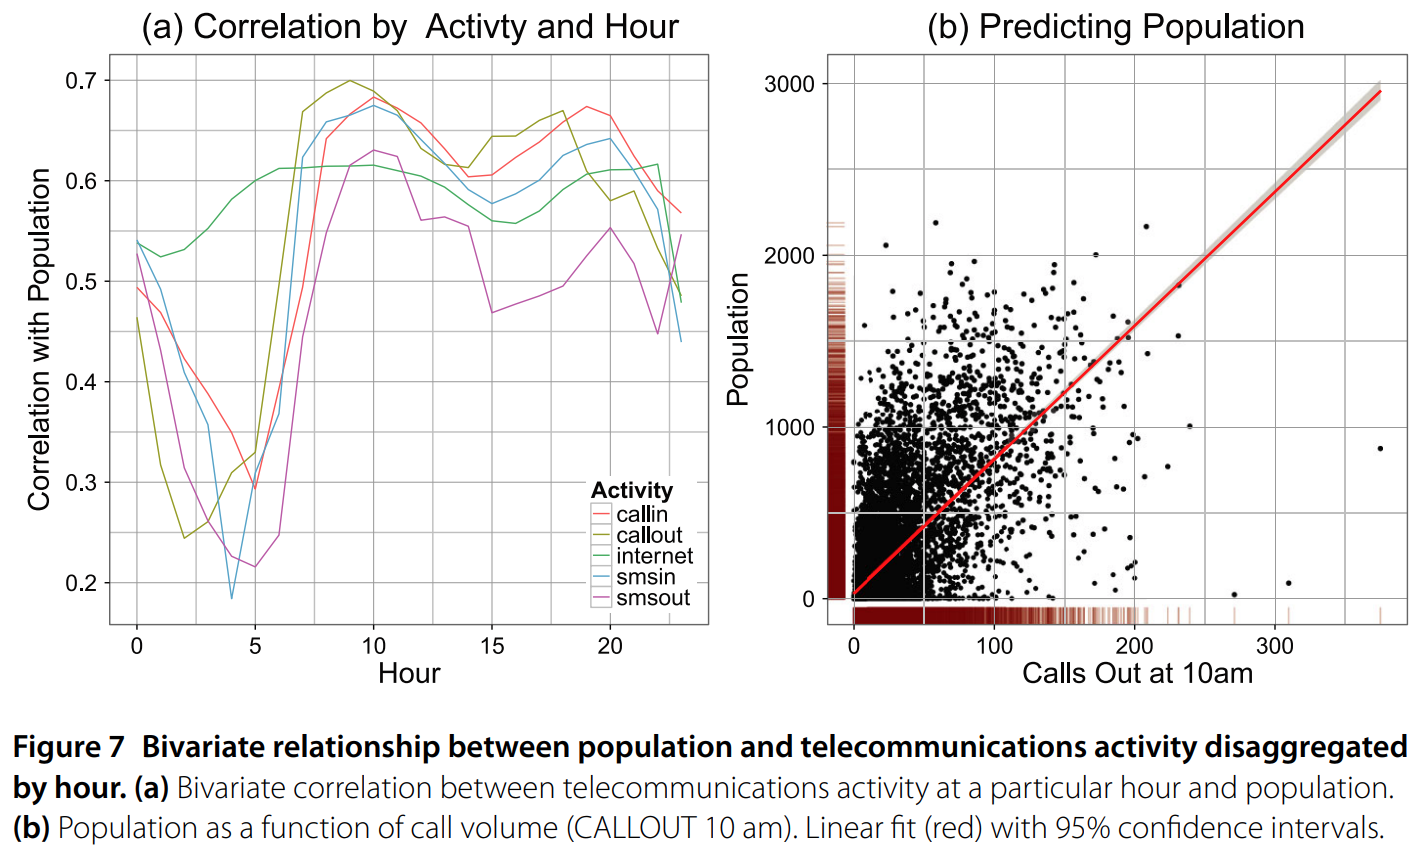
Population censuses are expensive and infrequent, but cell phone data are plentiful and real-time; how can we use one to estimate the other? We investigate the relationship between calling activity and demography at a very high 235 square meter resolution in Northern Italy.
“High resolution population estimates from telecommunications data” with (David A Meyer, Megha Ram, David Rideout, and Dongjin Song) EPJ Data Science 2015, 4:4
Top 10 finalist of 652 projects in Telecom Italia Big Data Challenge 2014.
7.1 Telecommunications activity correlates with census population counts
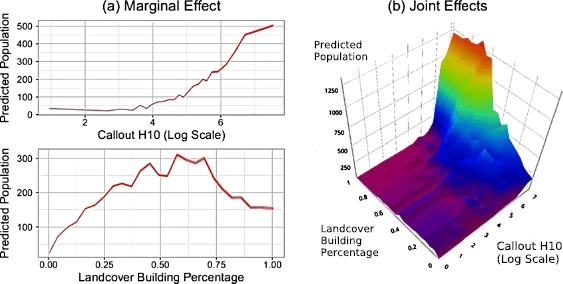
7.2 Adding landcover improves predictive performance
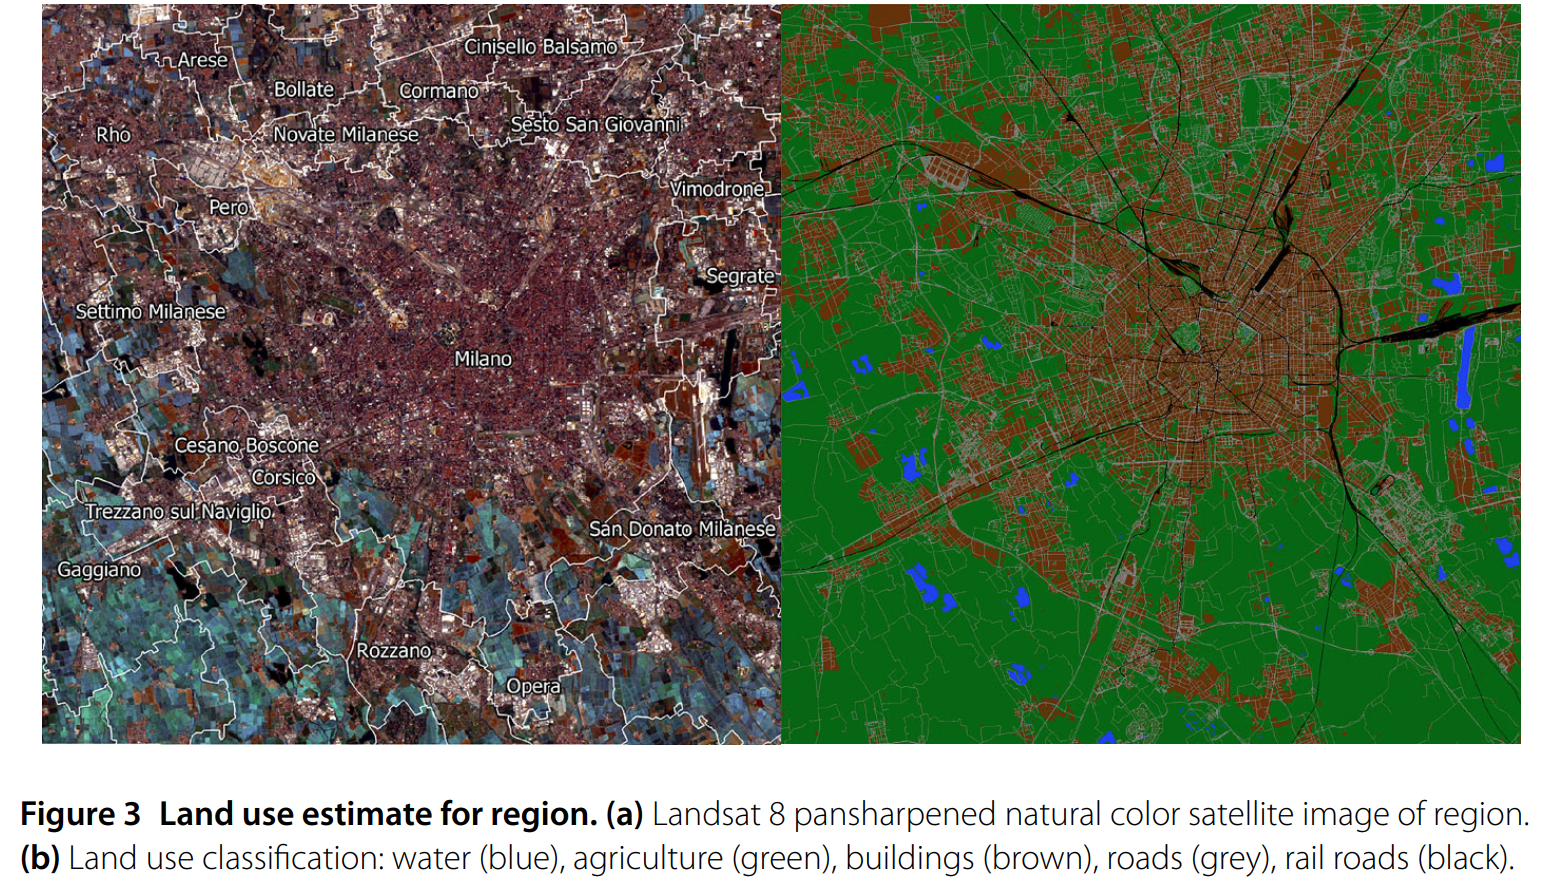
7.3 Landcover extracted from satellite imagery
7.4 Demographics from Phone Calls
“Analyzing Social Divisions using Cell Phone Data” (with Orest Bucicovschi, Rex W. Douglass, David A. Meyer, Ram Rideout, Dongjin Song) [Ungated Conference Preprint] Awarded Best Scientific Paper in the Data for Development (D4D) competition at NetMob 2013, MIT, Cambridge, MA (1-3, May 2013); Conference Preprint
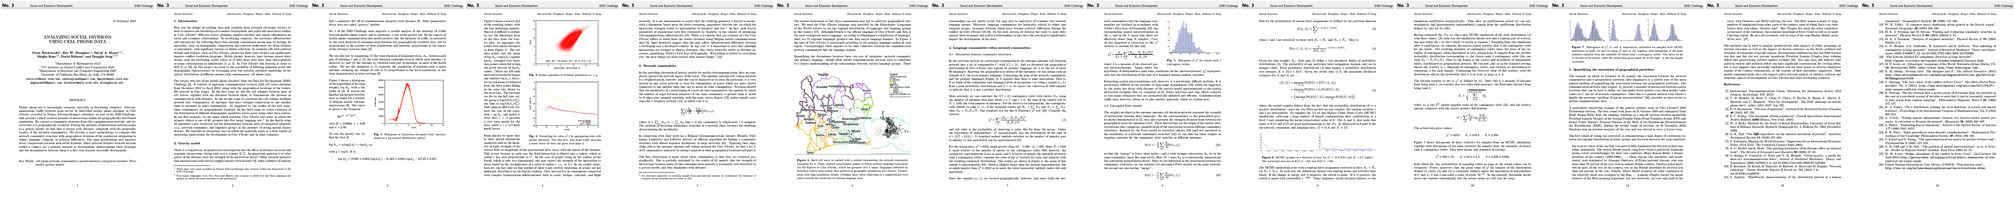
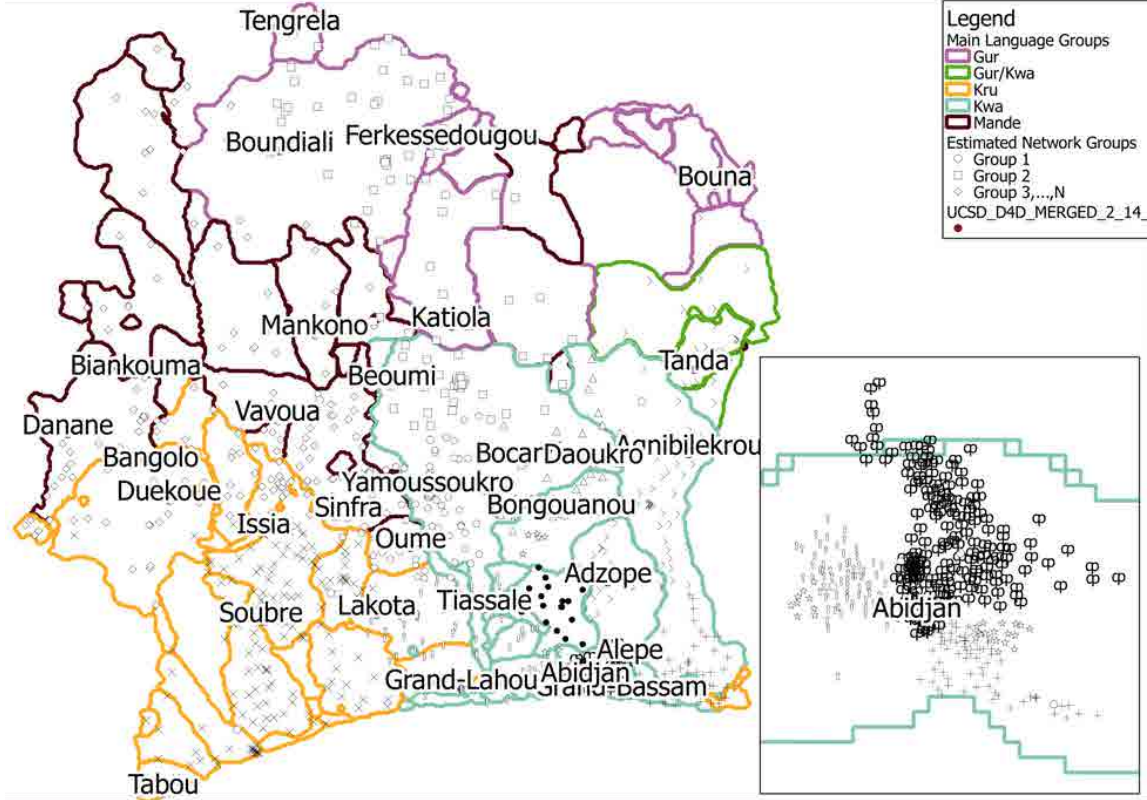
Each cell tower is marked with a symbol representing the network community computed for it.
These network communities appear to follow primary language boundaries (for 60 dialects in Cˆote d’Ivoire, which are grouped into 4 major languages indicated by boundary colors) more closely than political or geographic boundaries (not shown).
Areas with high population density (Abidjan inset) show clustering at a neighborhood level which exceeds the resolution of existing language data.
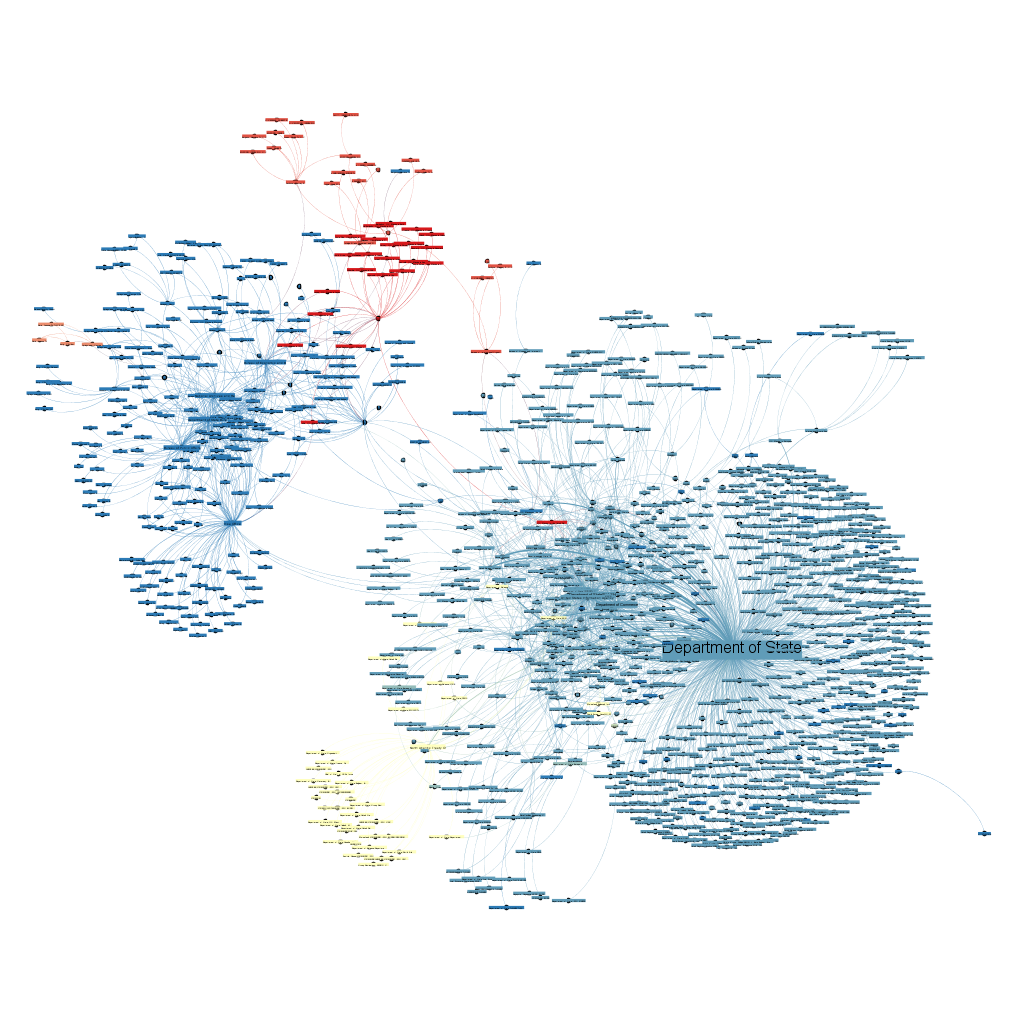
8 Diplomatic Telegrams
―Imagery―
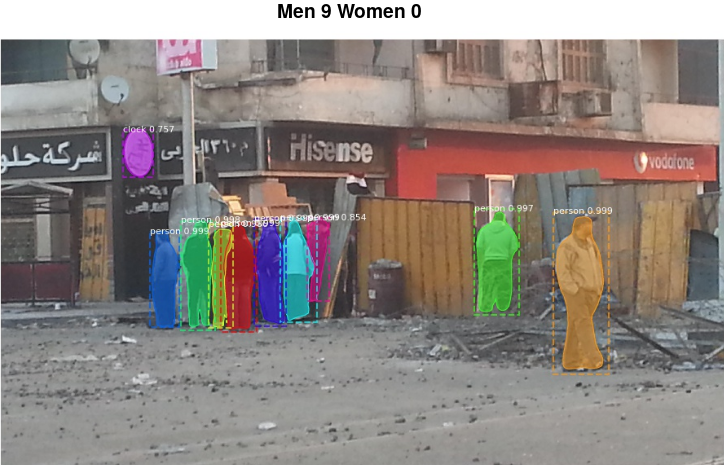
9 Crowd Counting in Imagery
Large Scale Content Analysis of Protest Imagery Final Delivery Summary
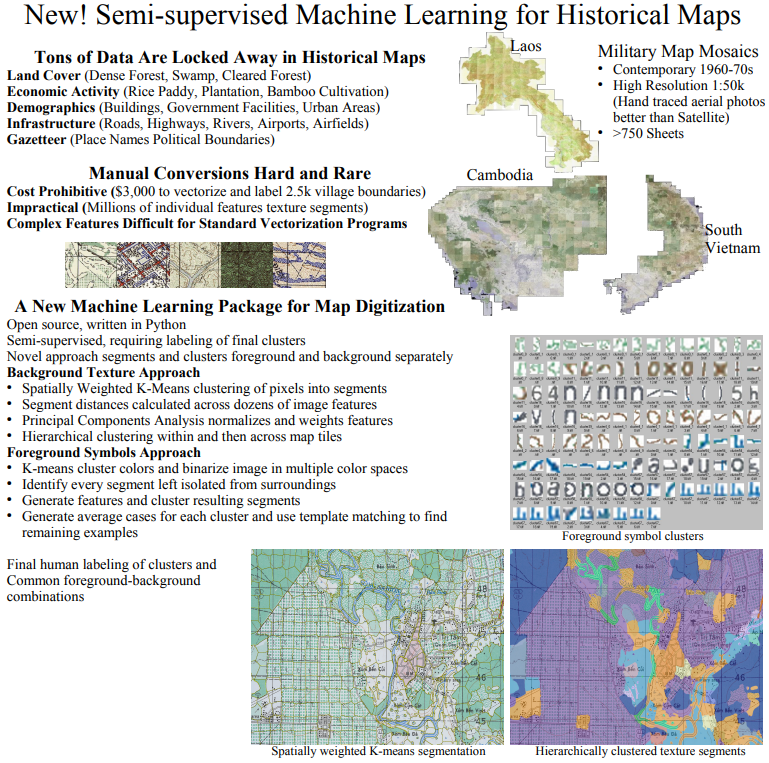
10 Machine Vision for Military Maps
―Extremely Wide Data―
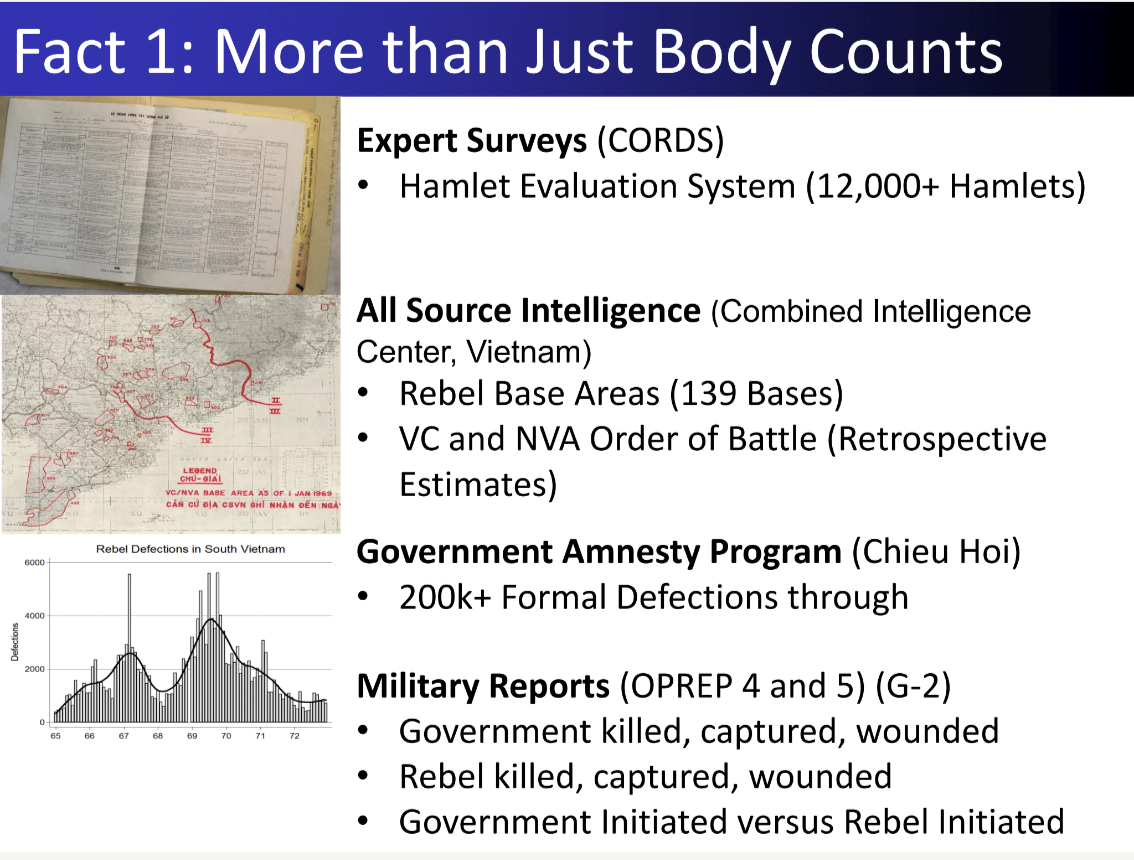
11 ML for Military Intelligence
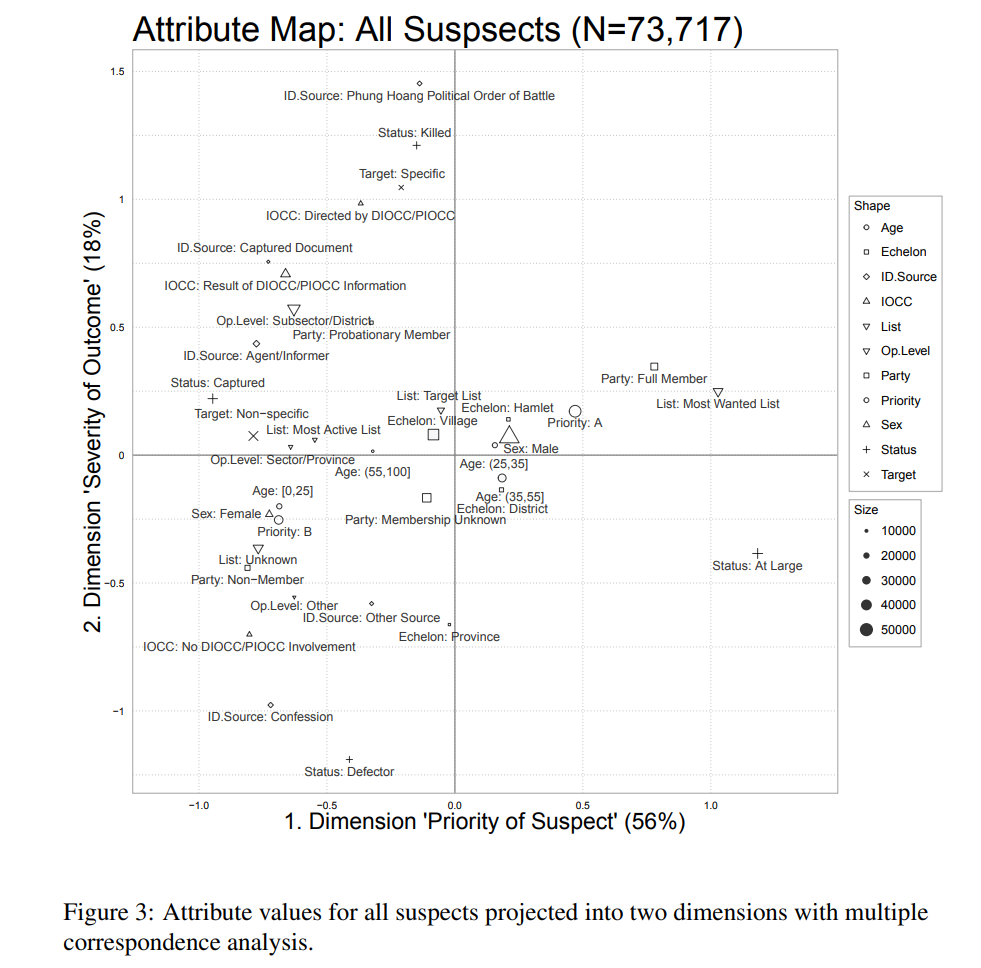
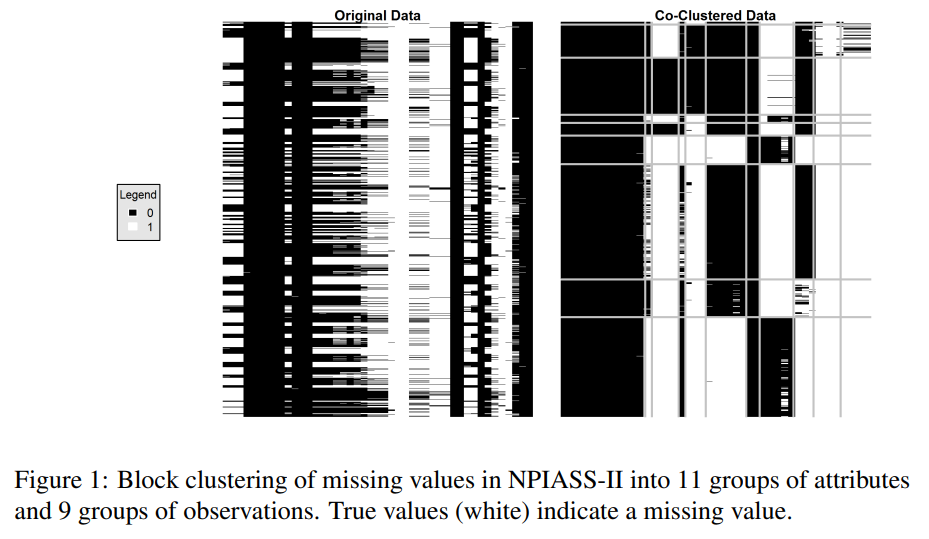
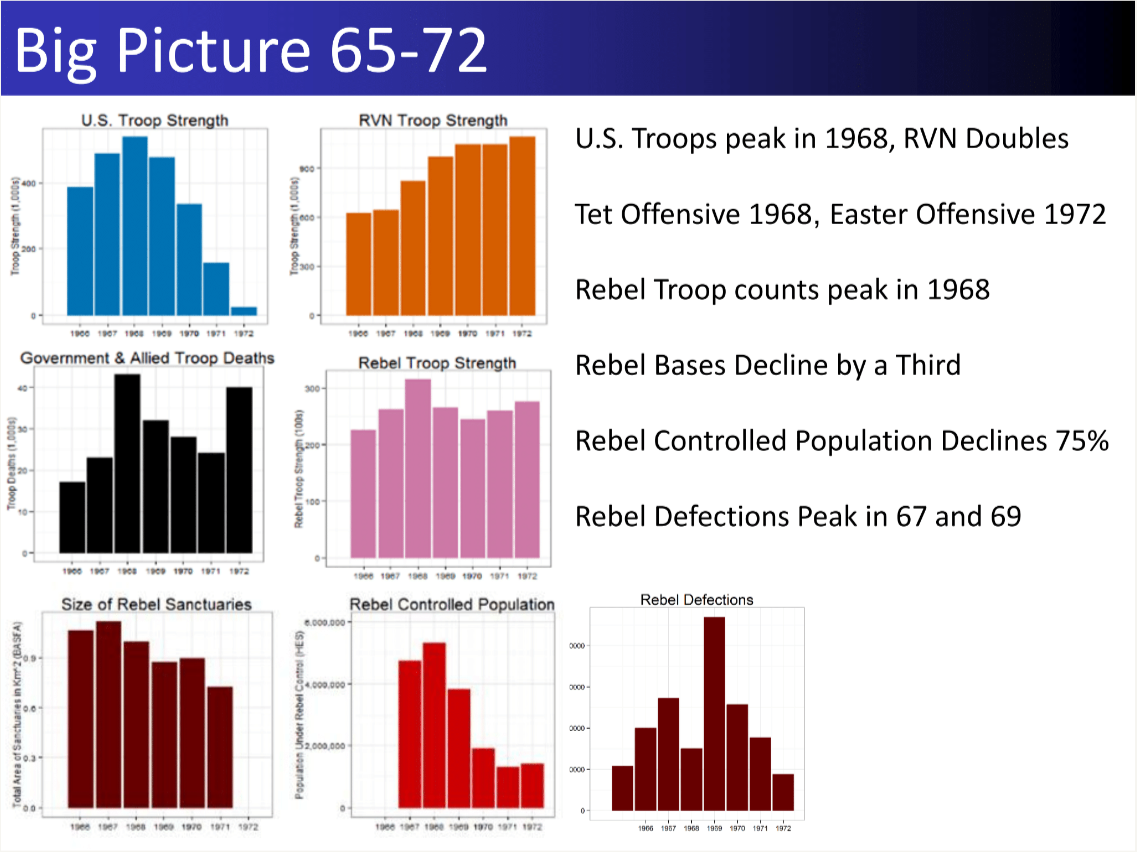
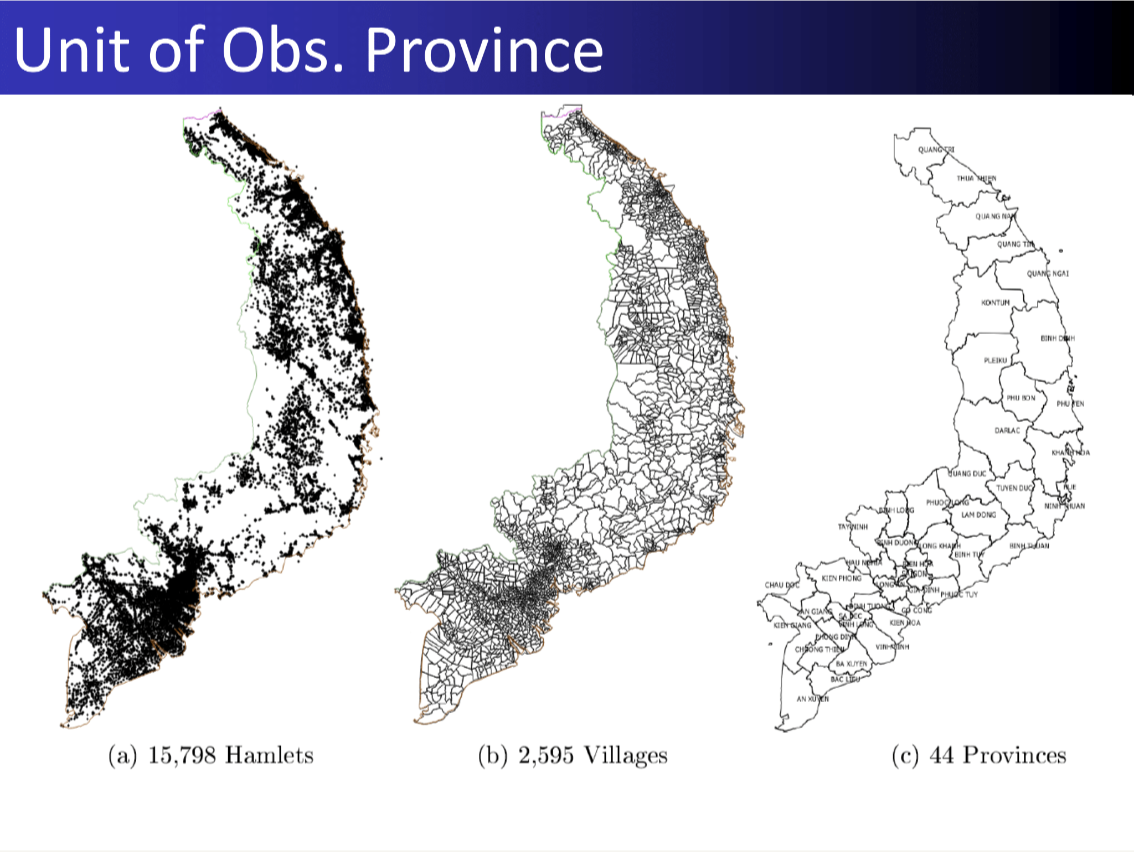
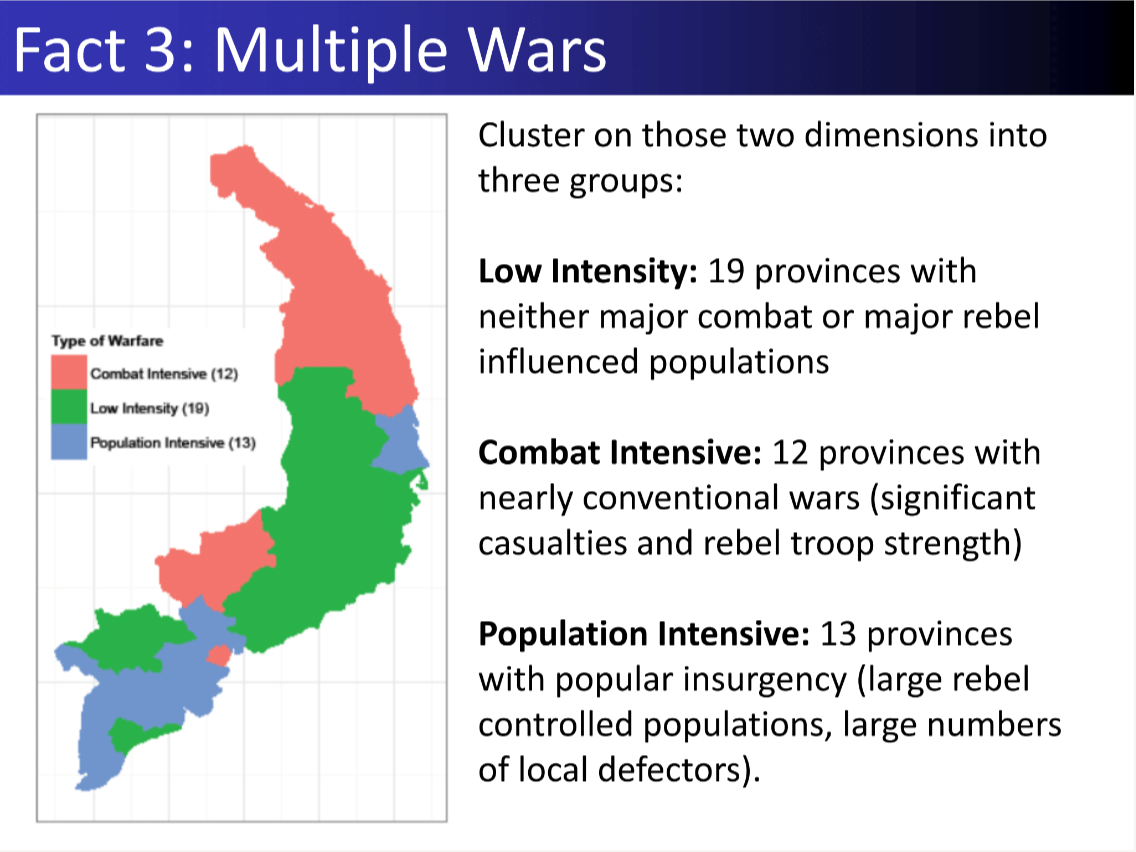
I investigate a contemporary government database of civilians targeted during the Vietnam War. The data are detailed, with up to 45 attributes recorded for 73,712 individual civilian suspects. I employ an unsupervised machine learning approach of cleaning, variable selection, dimensionality reduction, and clustering. I find support for a simplifying typology of civilian targeting that distinguishes different kinds of suspects and different kinds targeting methods.
“Understanding Civil War Violence through Military Intelligence: Mining Civilian Targeting Records from the Vietnam War” Chapter in C.A. Anderton and J. Brauer, eds., Economic Aspects of Genocides, Mass Atrocities, and Their Prevention. New York: Oxford University Press, 2016 [Ungated arXiv preprint]
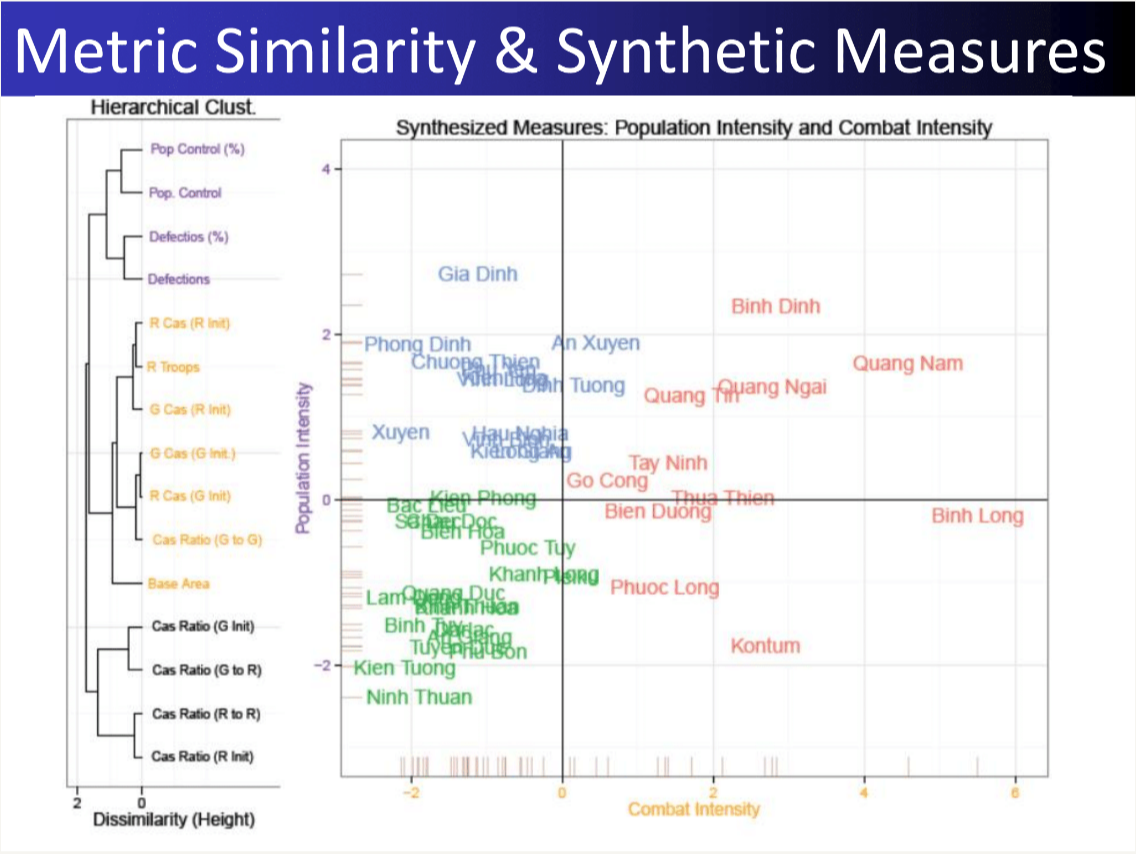
11.1 Dimensionality Reduction on Qualitative Measures
11.2 Forensics on Untrustworthy Data
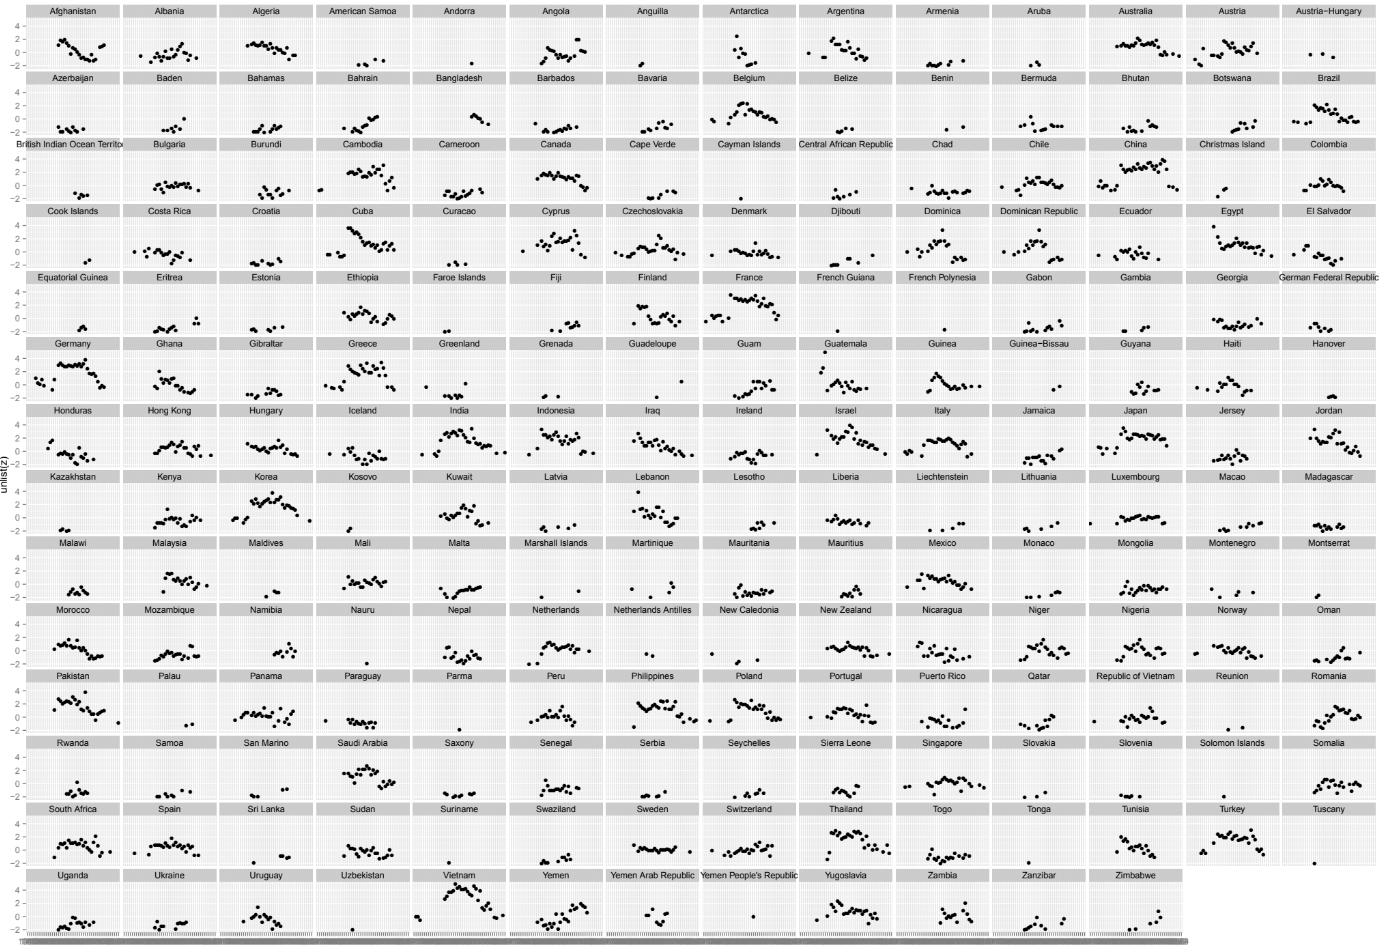
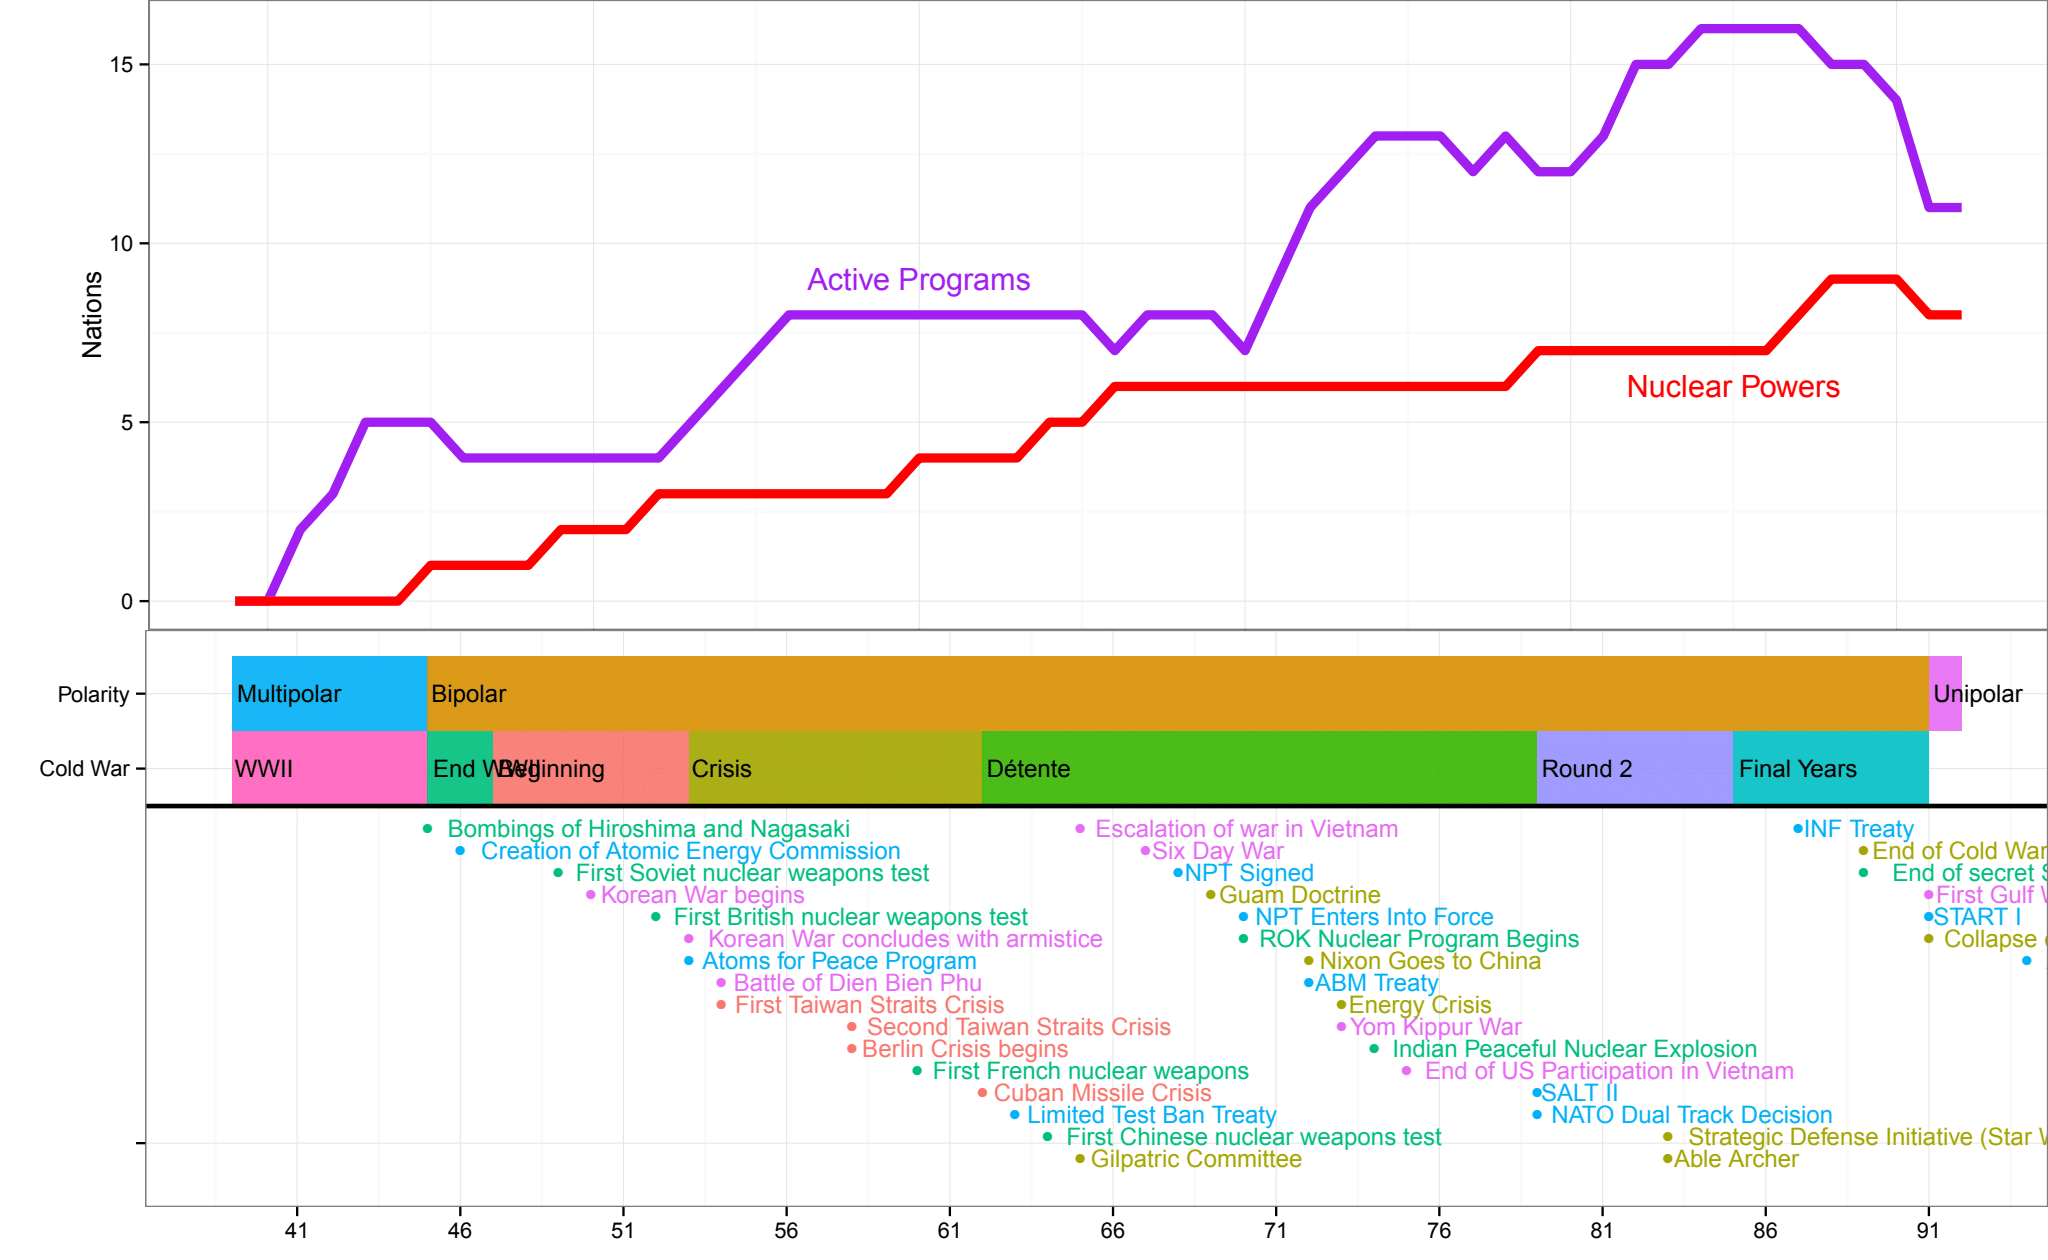
12 Nuclear Proliferation
12.1 Visualizing Panel Data with Regimes and Events
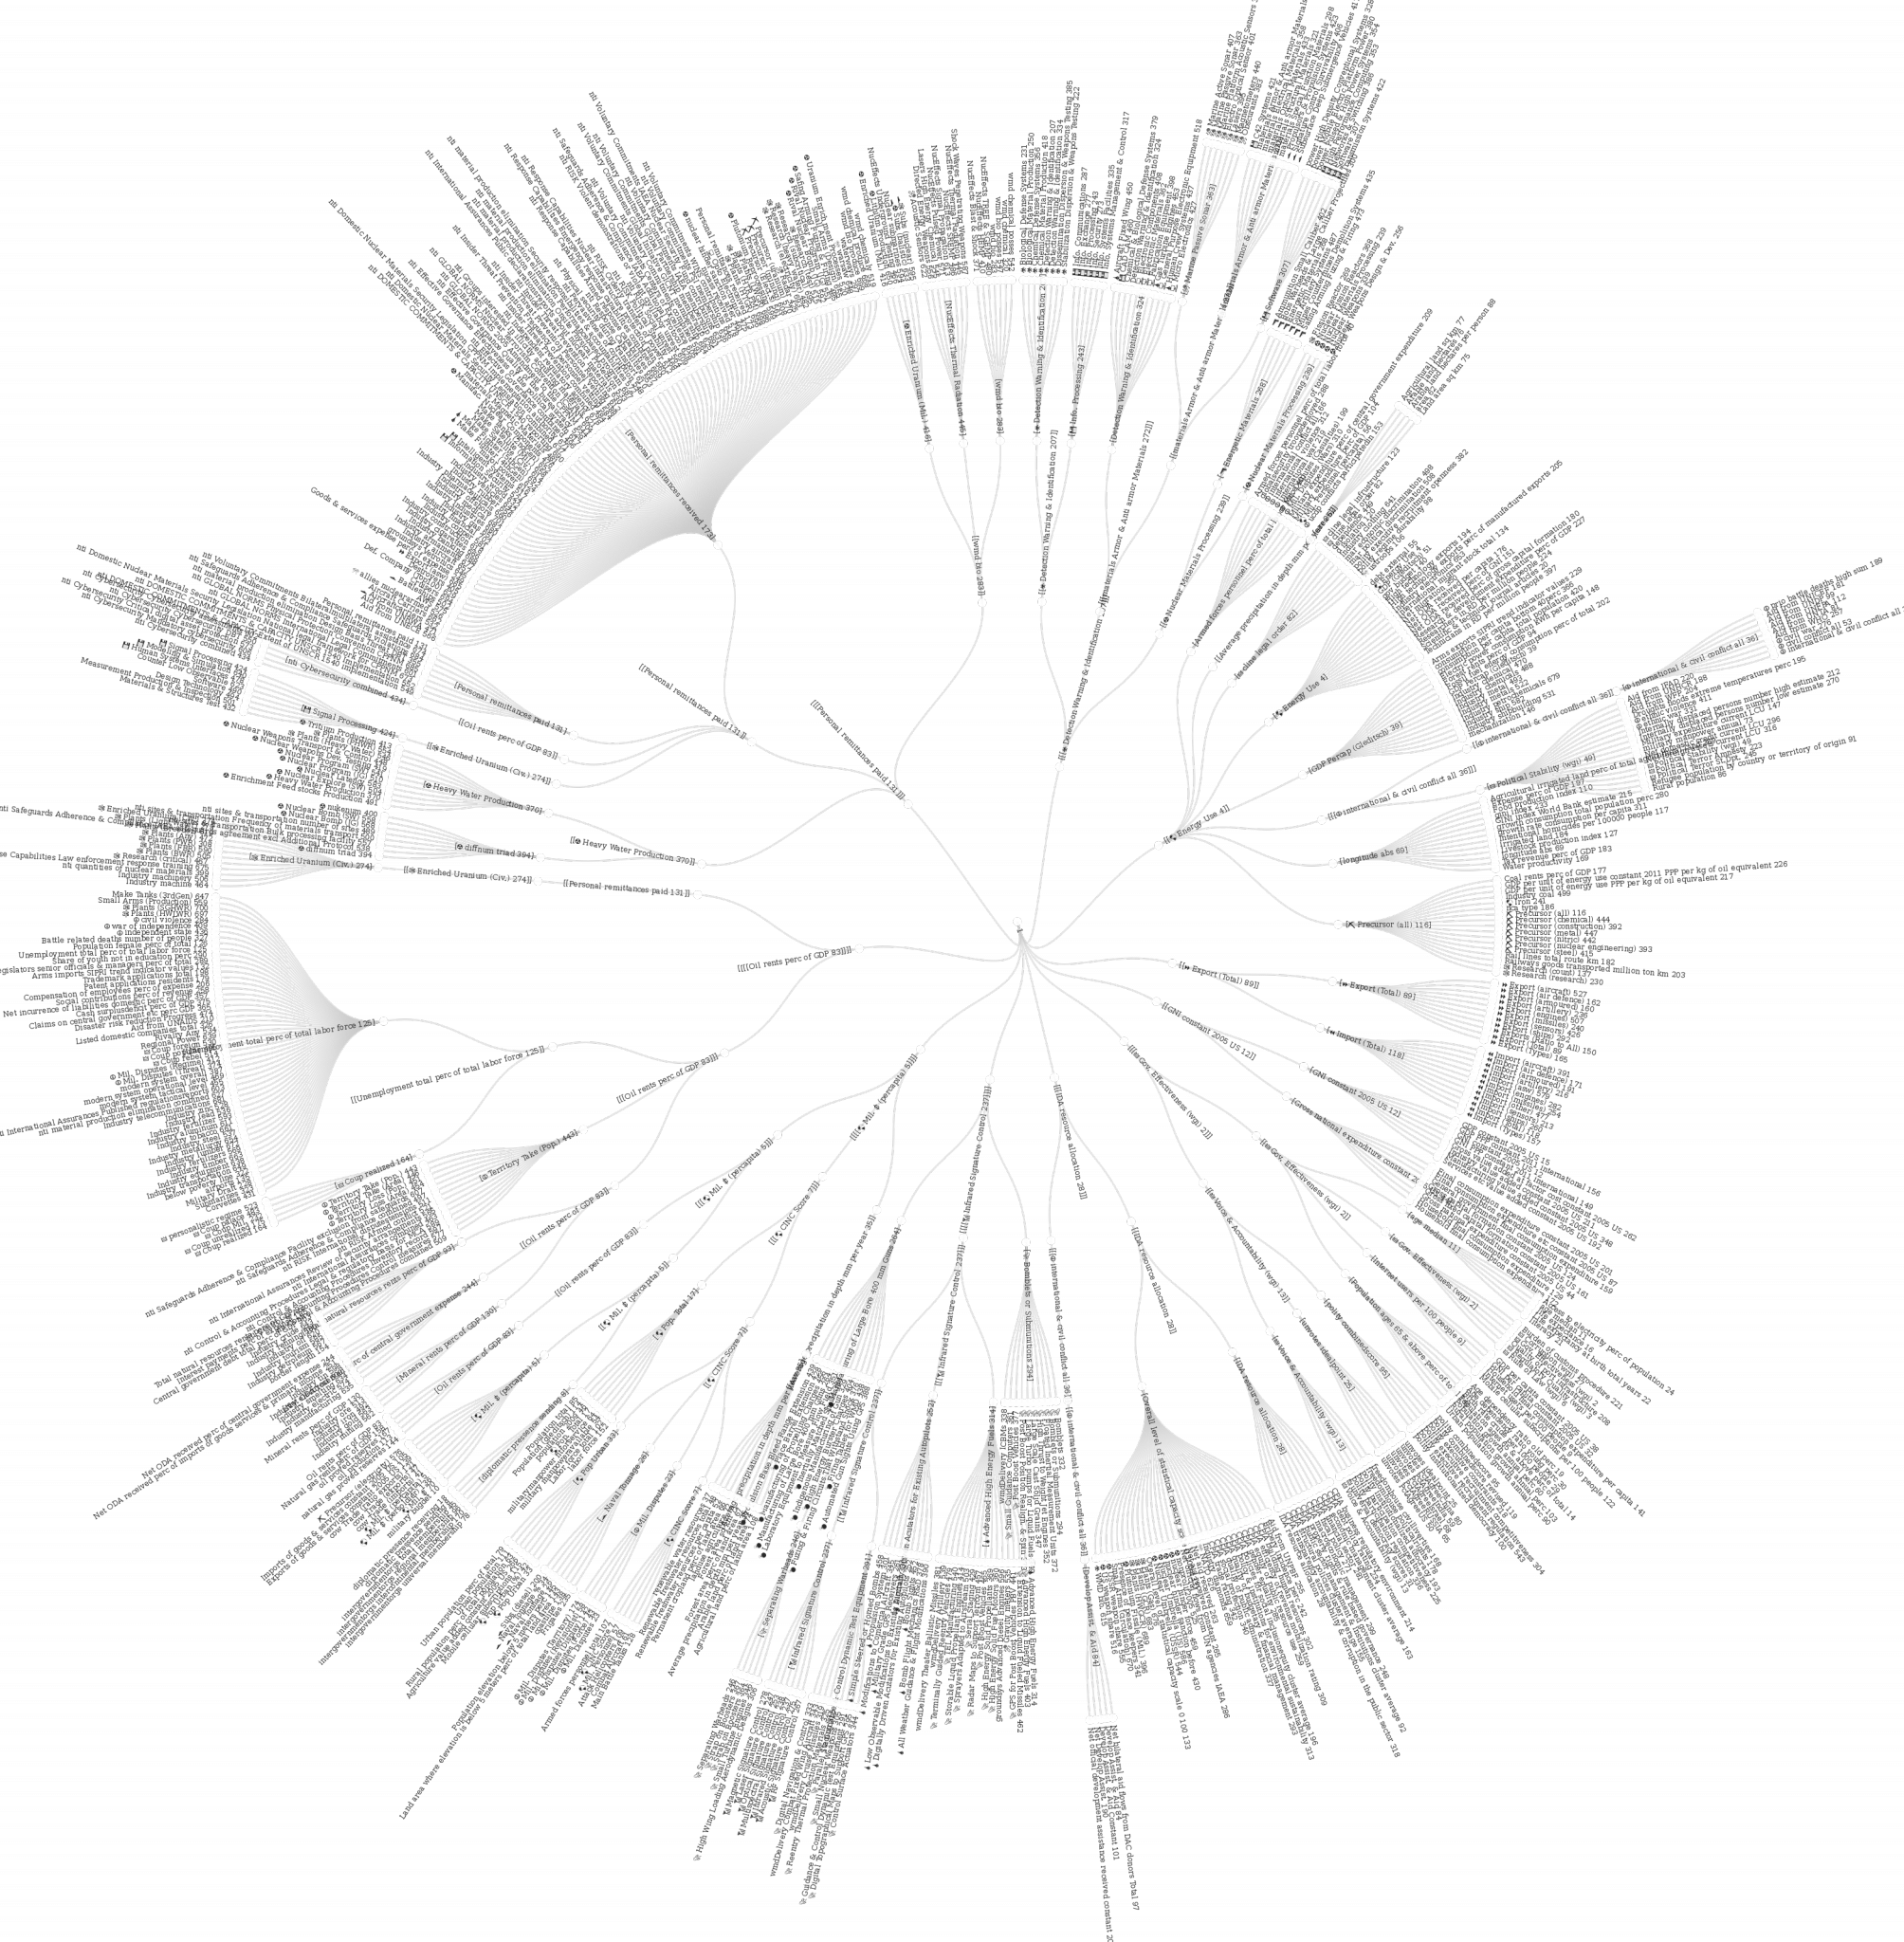
12.2 Hiearchically Clustering Correlated Features
―Forecasting―
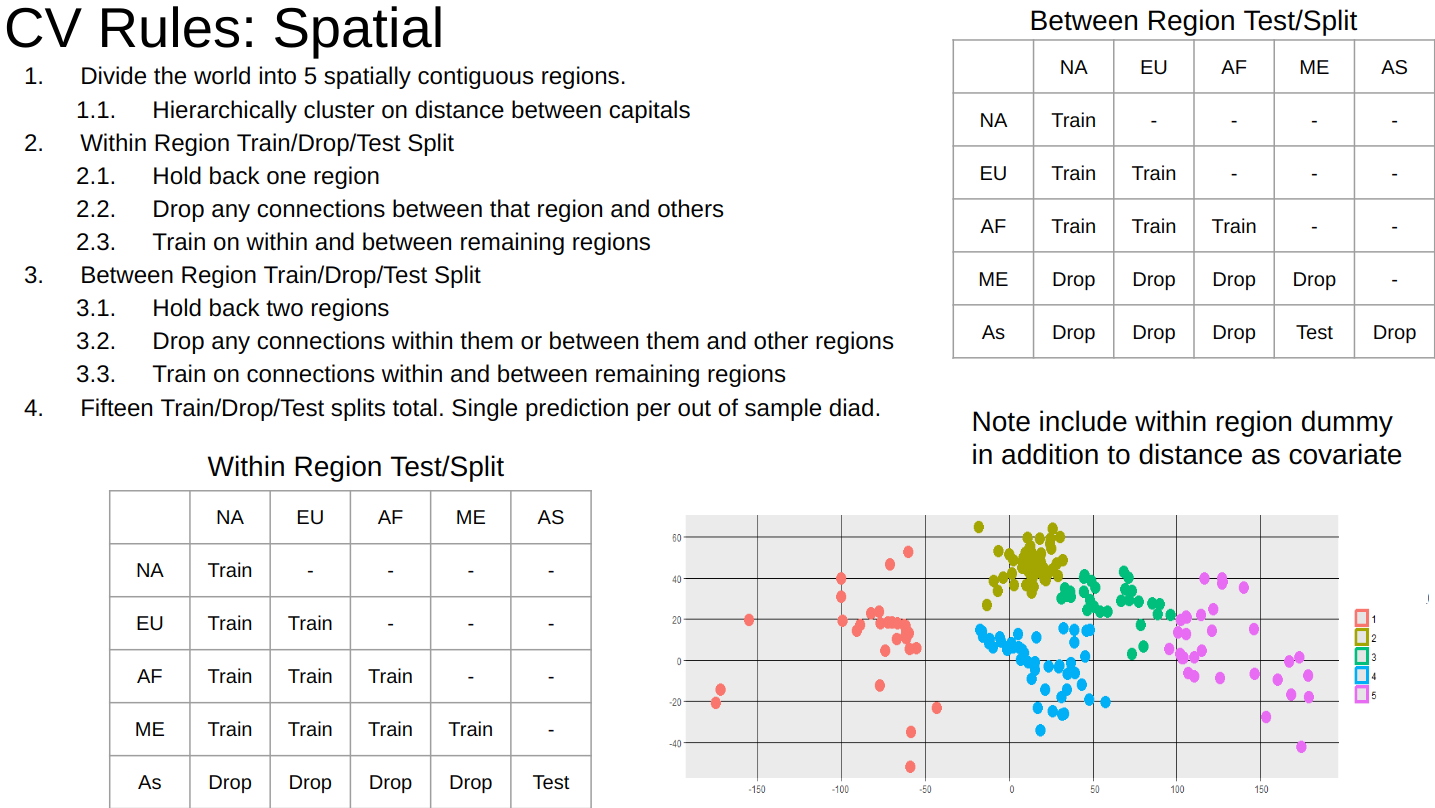
13 Cross-Validation for Spatial Panel Data
13.1 Spatial Holdouts
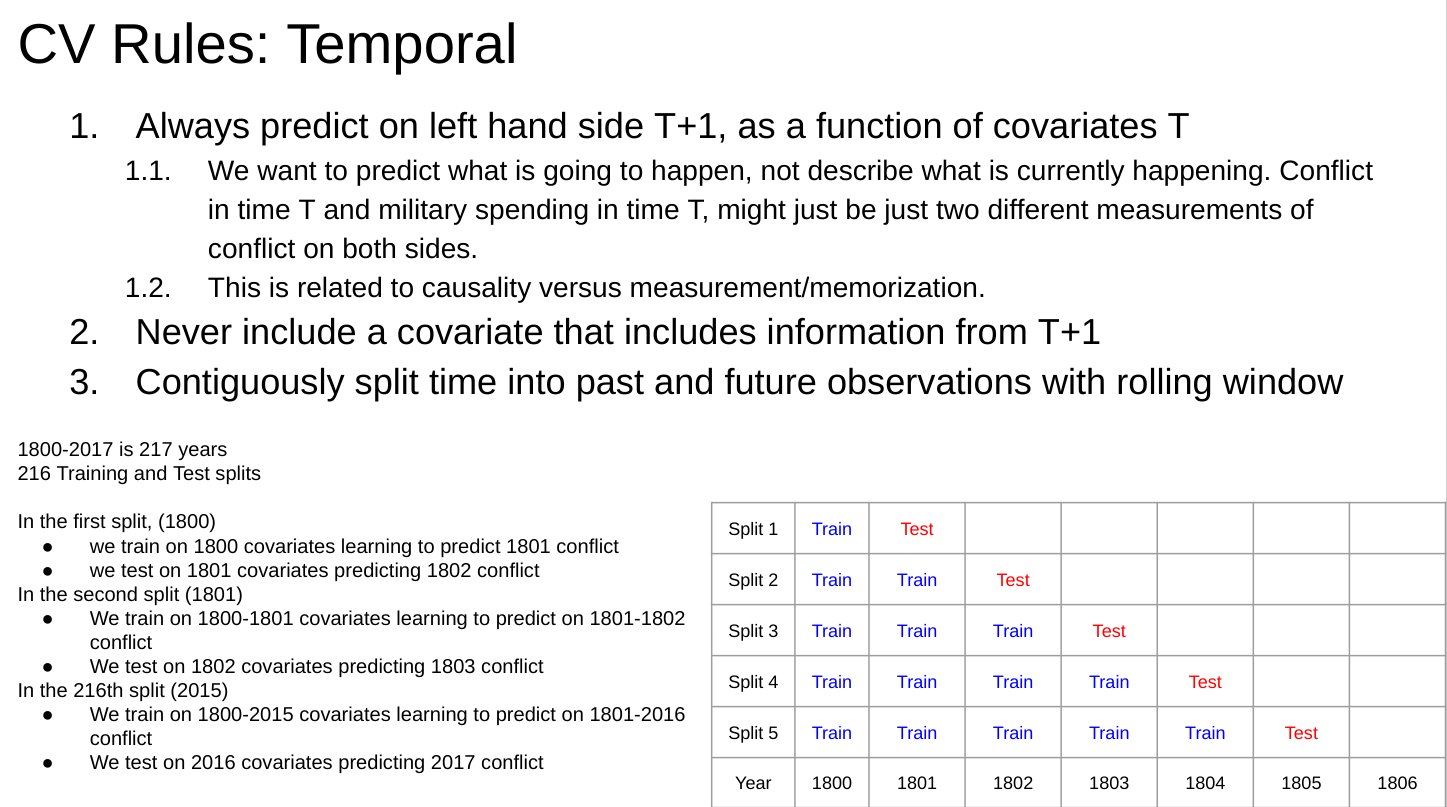
13.2 Rolling Temporal Holdouts
14 Forcasting Military Disputes

―Geospatial―
15 Georeferencing Accuracy
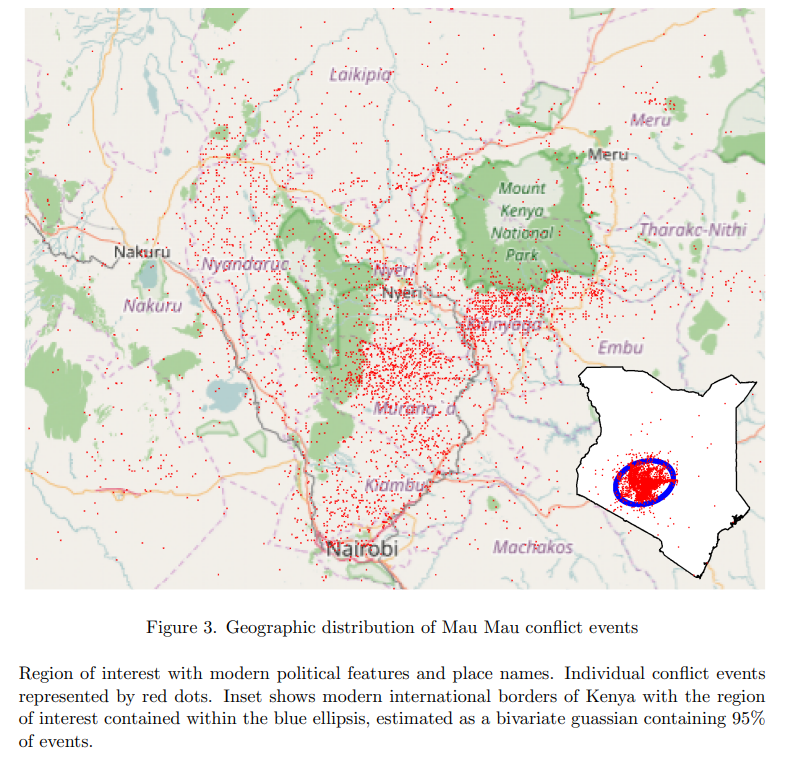
We show which natural language geo-referencing strategy you choose determines what downstream econometric result you’ll find. We develop a dataset of ten thousand events from the Mau Mau rebellion, drawn from twenty thousand pages of historical intelligence documents. We apply over a dozen geo-referencing strategies, and benchmark them against a known ground-truth in the form of exact military grid coordinates which were available for a subset of the reports.
“Measuring the Landscape of Civil War” (with Kristen Harkness) Journal of Peace Research, February 15, 2018 [Github], [Ungated Paper], [Ungated Appendix], [Gated Paper]
15.1 Military Events
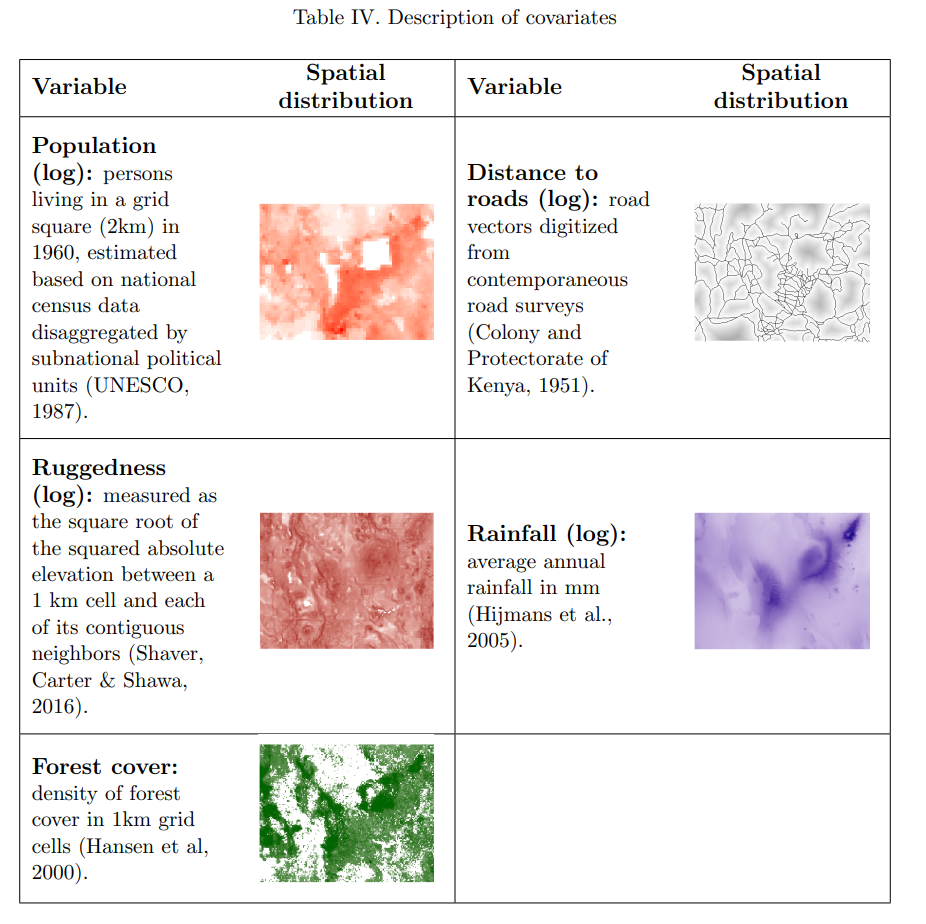
15.2 Visualizing Geospatial Covariates
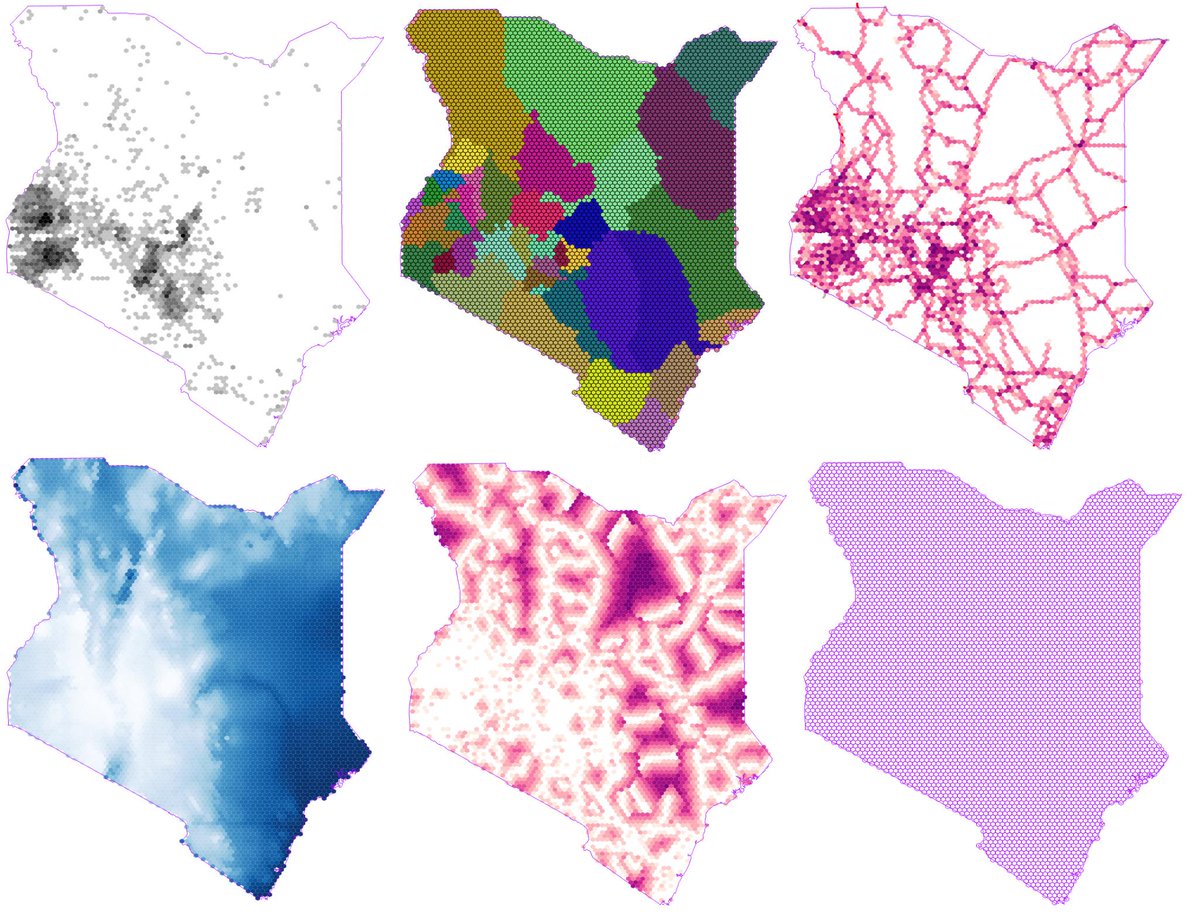
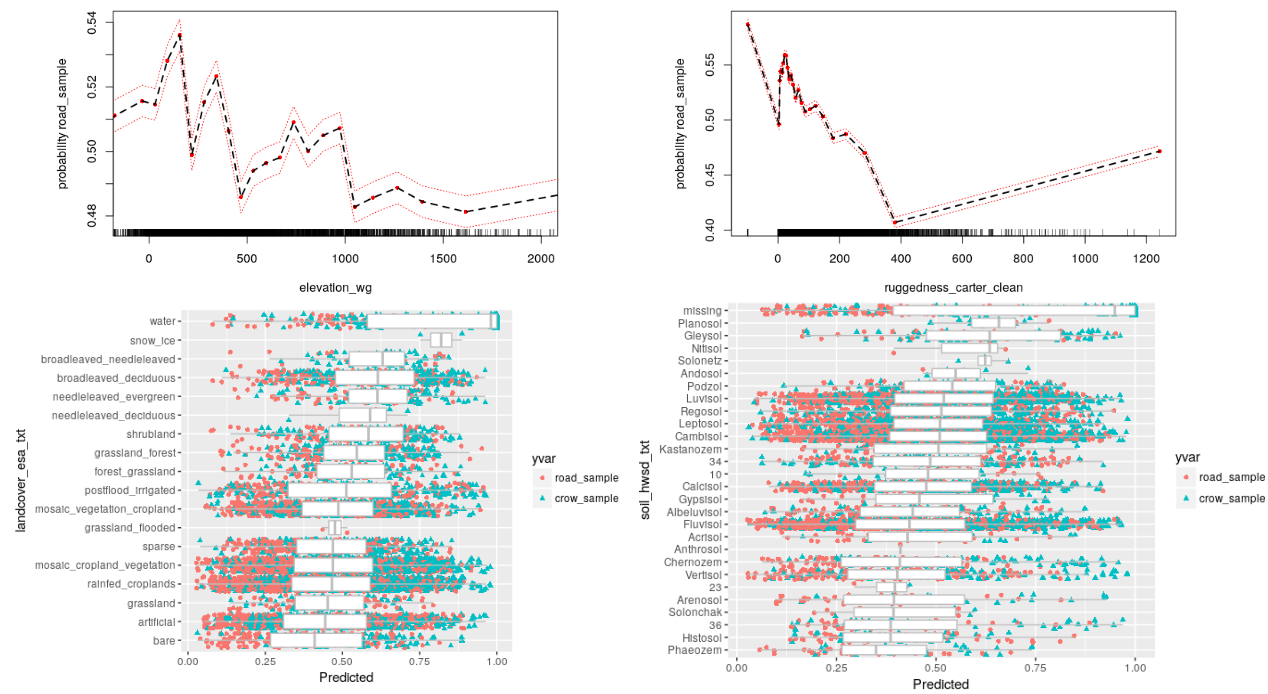
15.3 Computing geographic features with hexagonal binning
16 Remote Sensing for Terrain Difficulty
.png)
Red easy travel to blue for difficult
.png)
.png)
16.1 Empirical Measure of Travel Difficulty
17 Naval Travel and Global Wind Patterns
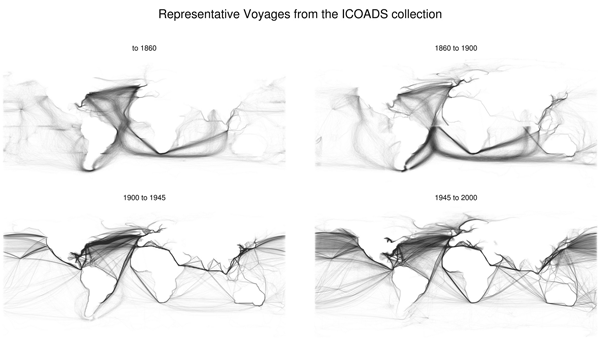
WORLD SHIPPING ROUTES, 1750-2000. SOURCE: BEN SCHMIDT.
Change over time
Opening of Suez and Panama
Switch from sail to steam
Improved sailing maps
Faster ships
.png)
.png)
International Comprehensive Ocean-Atmosphere Data Set (ICOADS)
87,810,493 observations of ship location, wind, and weather conditions
1662-2014
Infer ship course and speed from locations and model as a function of reported wind speed and direction
Calculate synthetic sailing profiles annually
18 Historical Cities and Borders
―Knowledge Graphs―
19 Named Entities for Social Science (NESS)
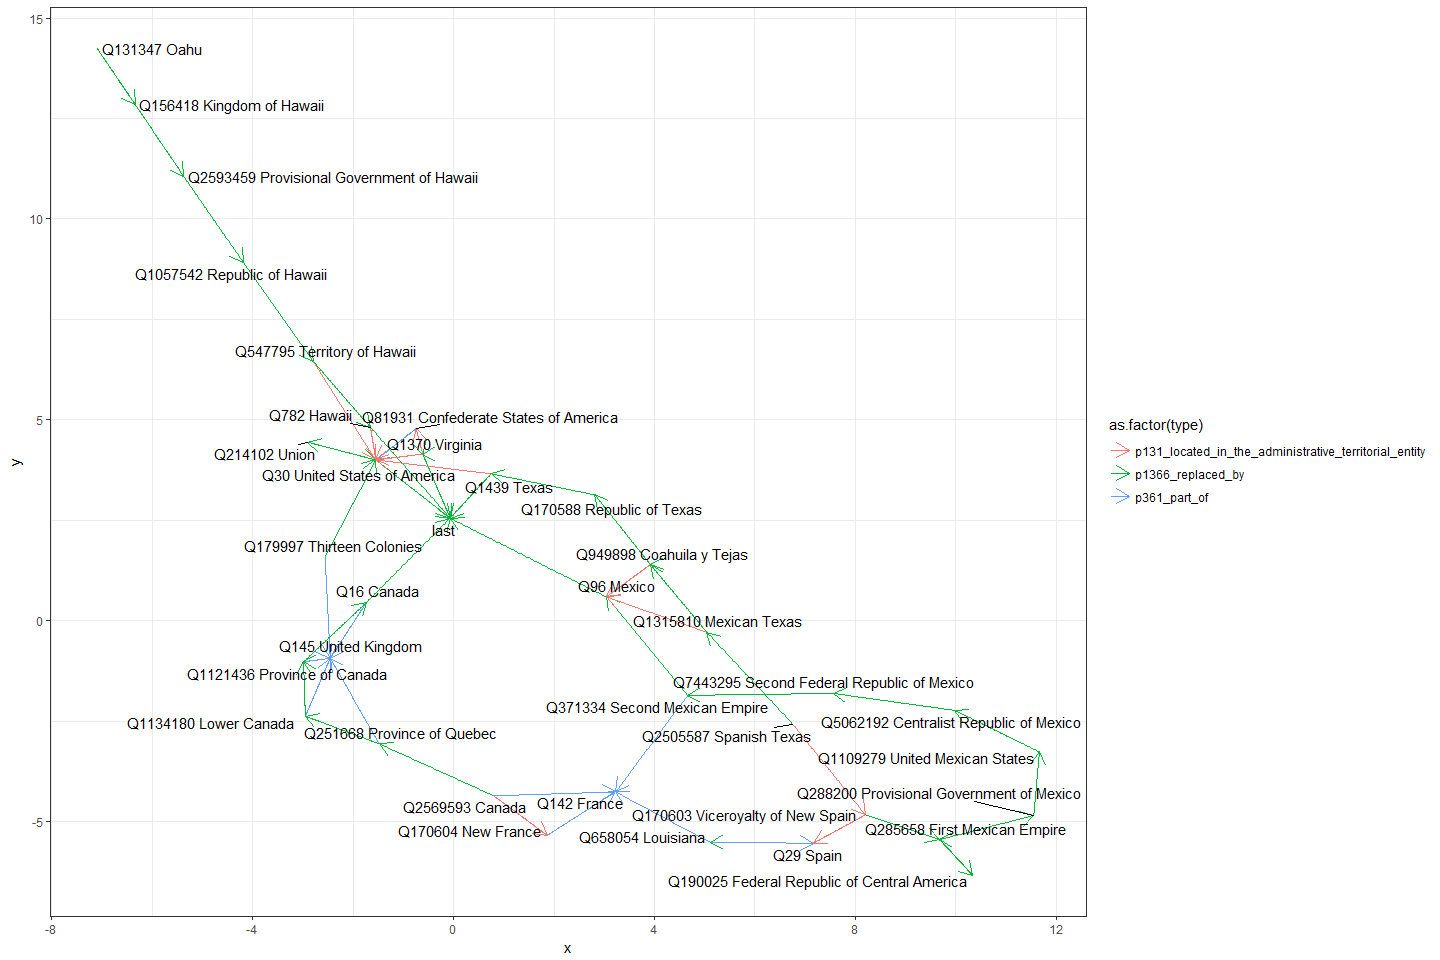
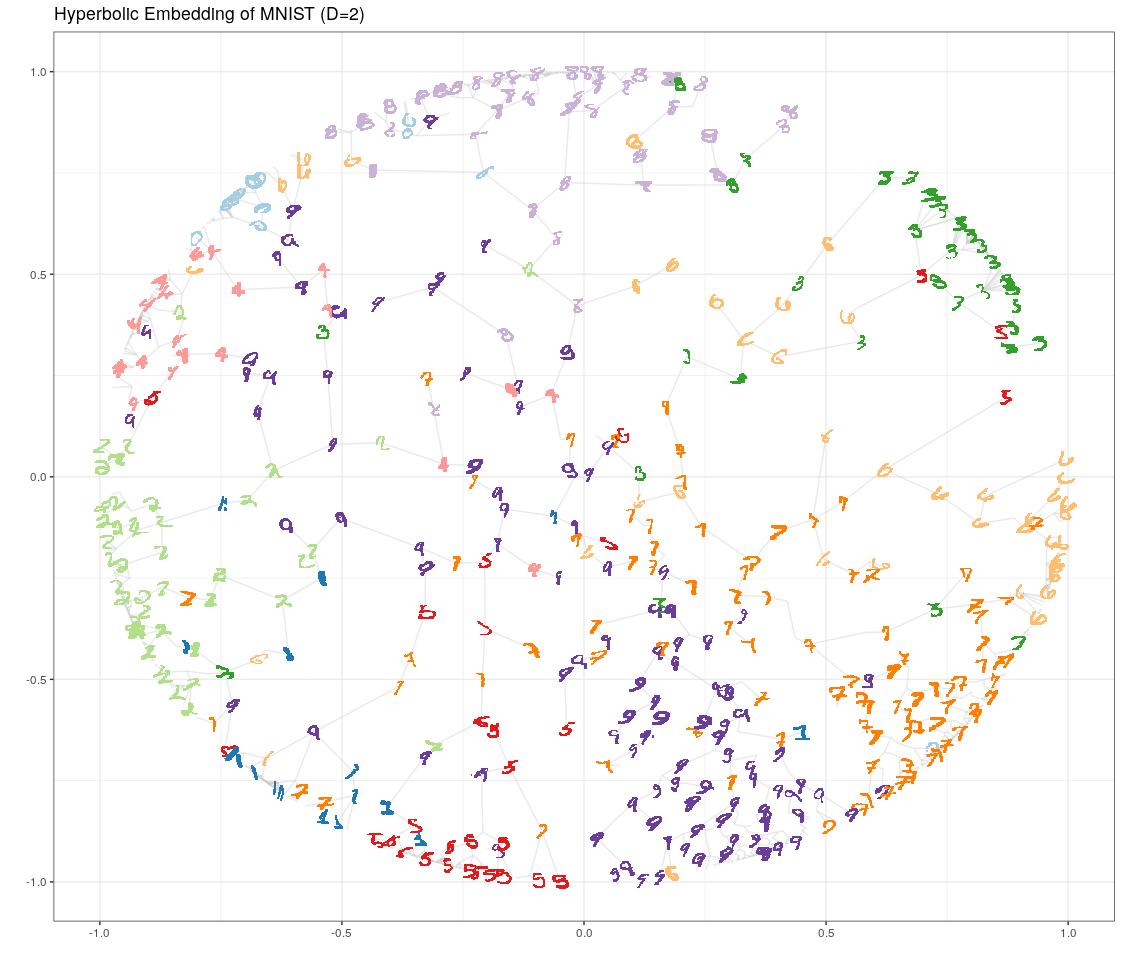
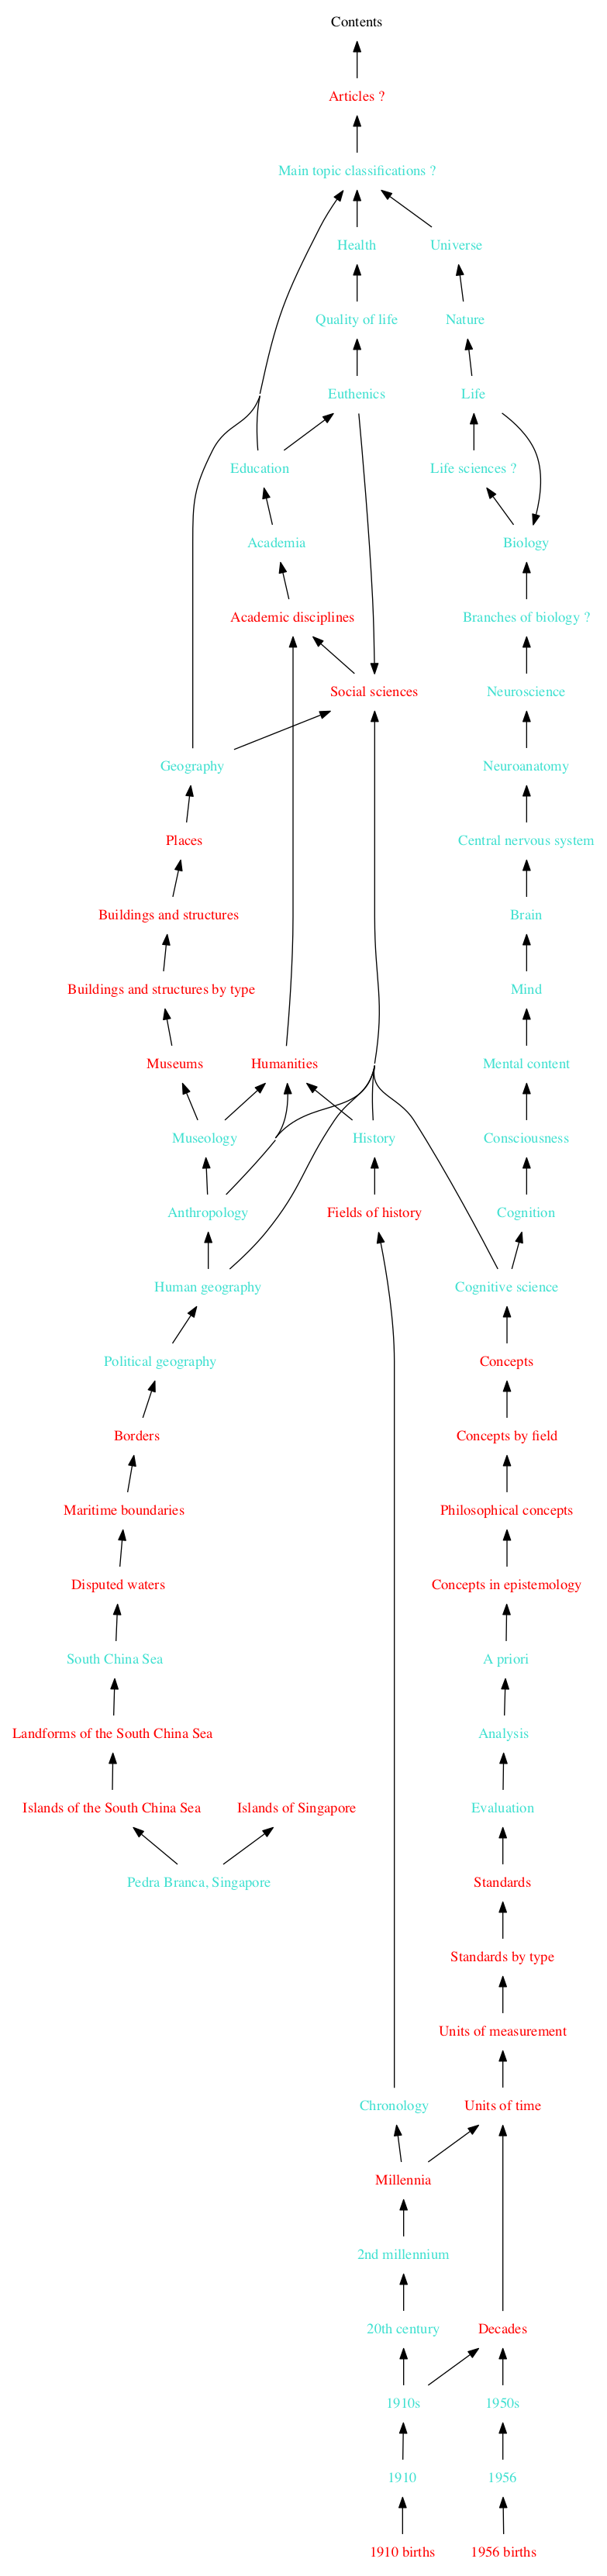
20 Learning Hierarchy
―Experiments―
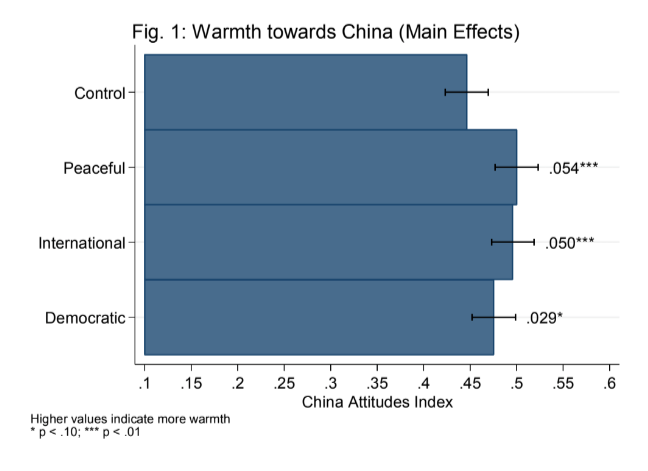
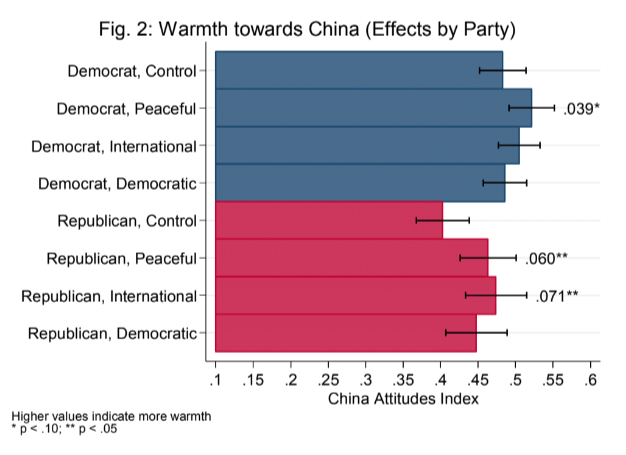
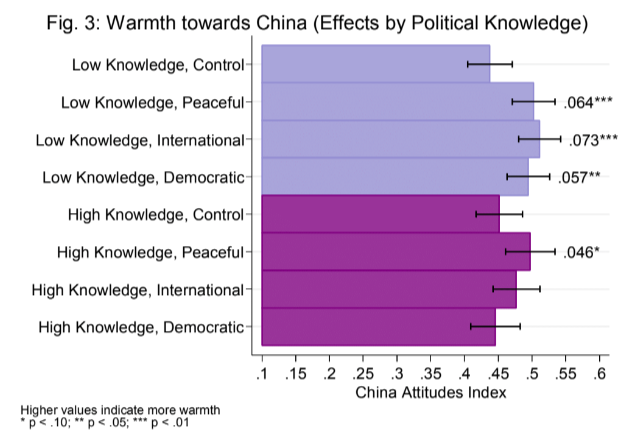
21 mTurk Survey Experiment


―Internet Searches―
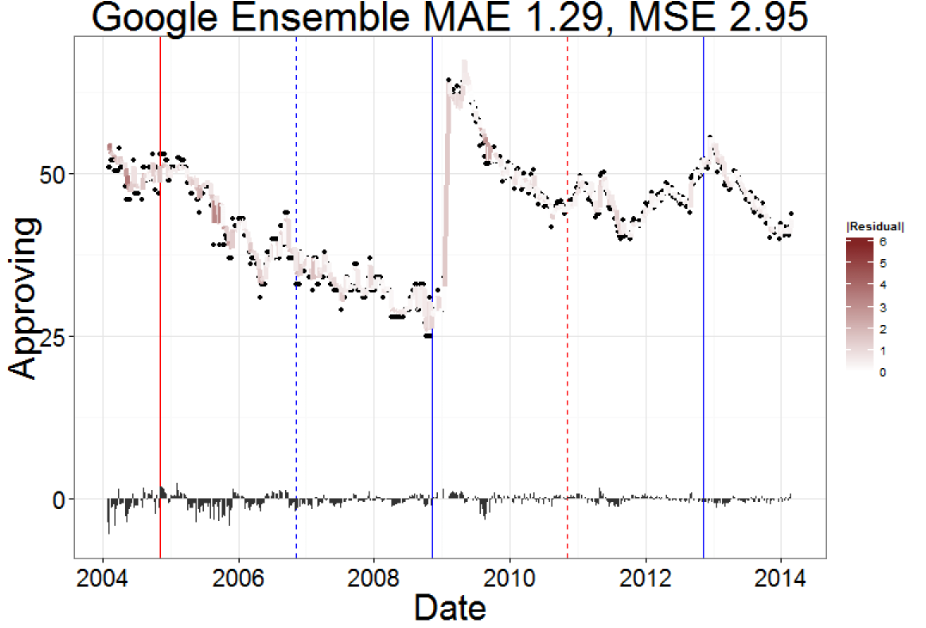
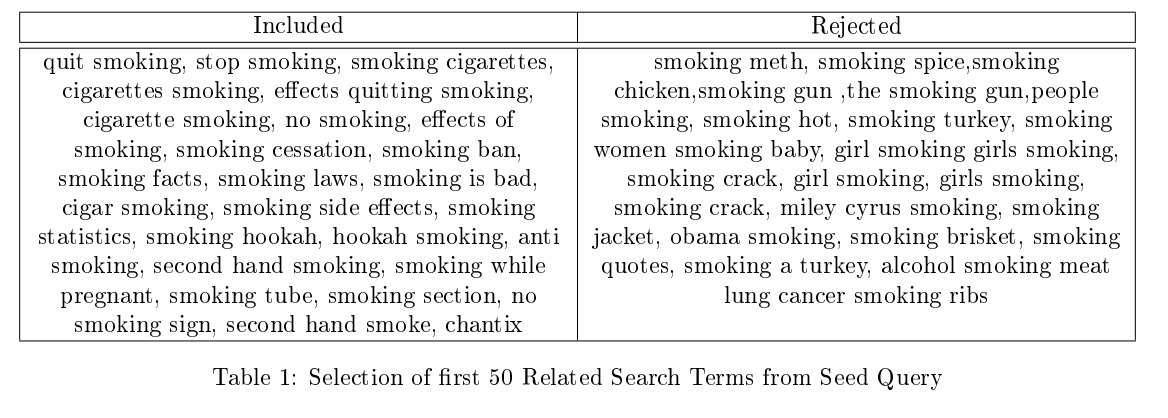
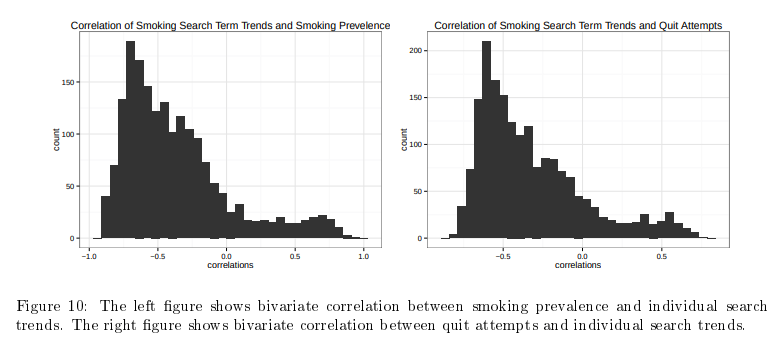
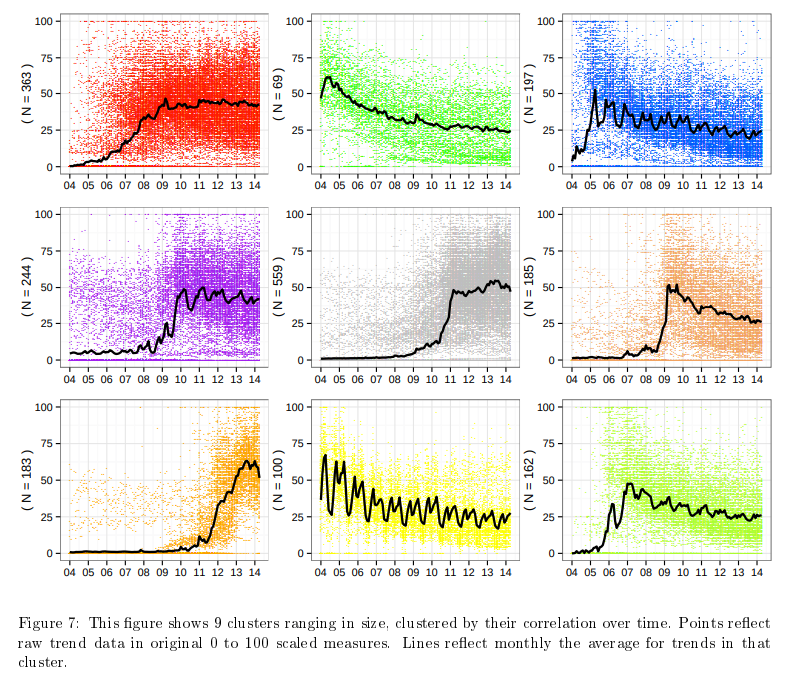
22 Forecasting Public Opinion with Search Behavior
No change predictor already pretty good
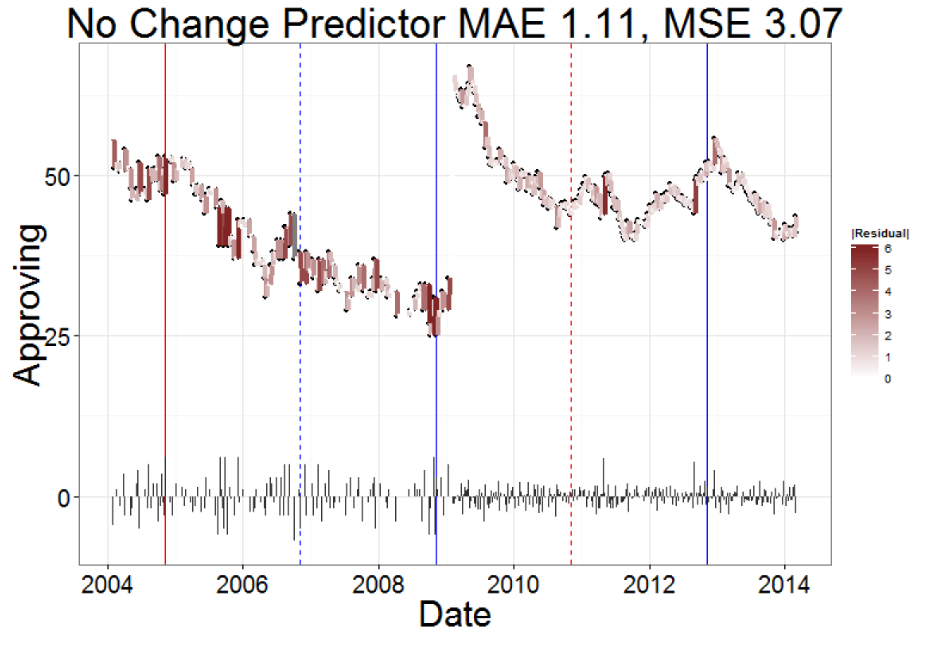
Ensemble of simple time-series features decrease MAE 40% and MSE 74%
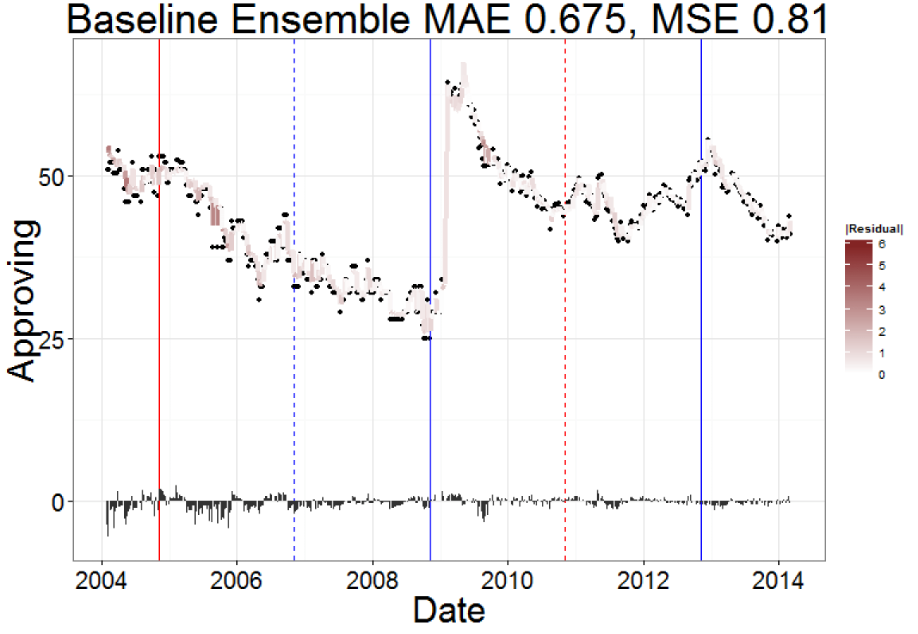
Google ensemble actually performs worse.
―Time Series―
23 Changepoint Detection for Time Series
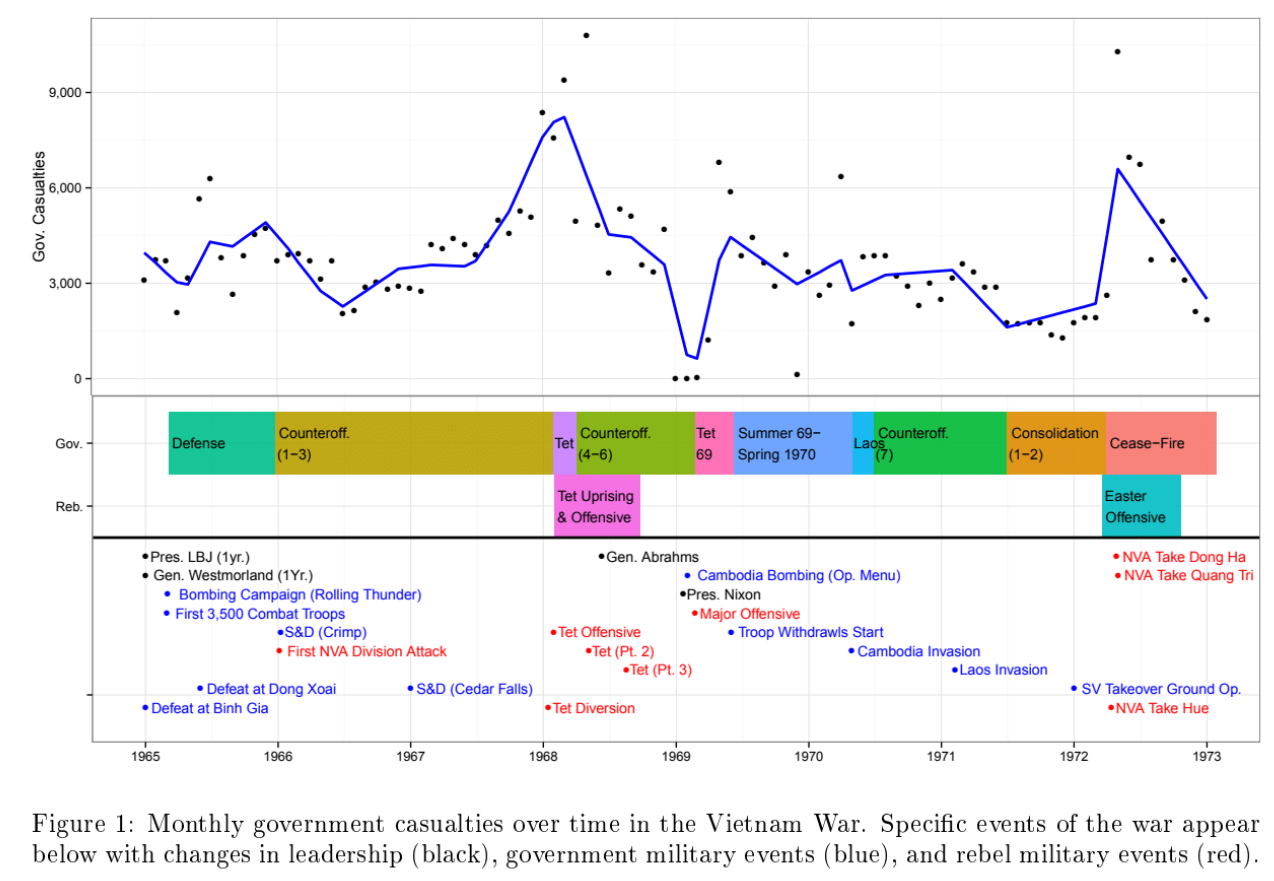
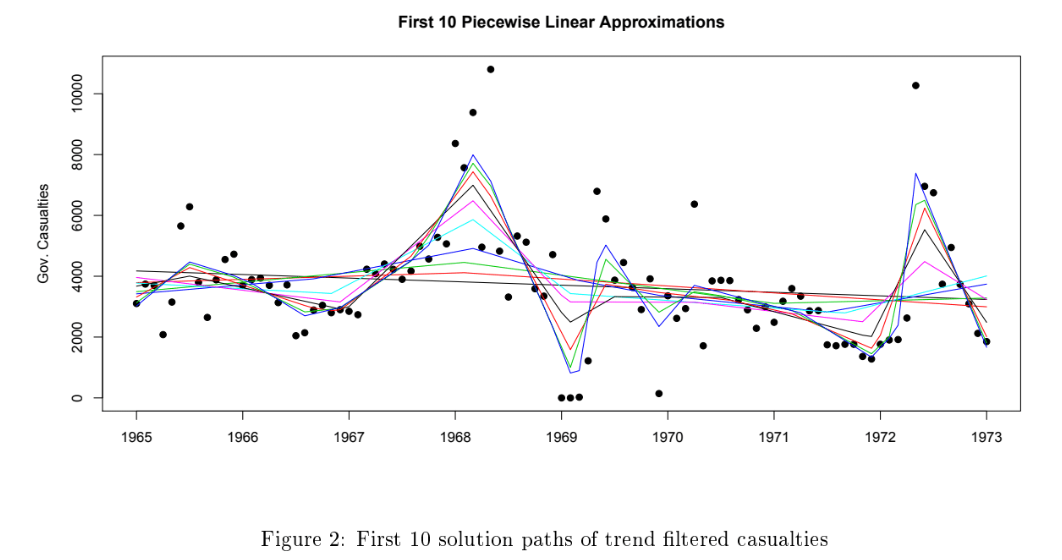
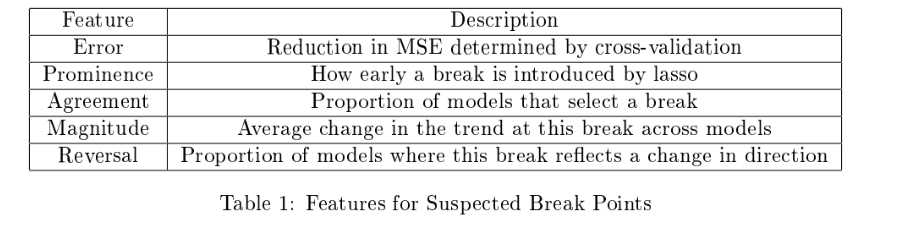
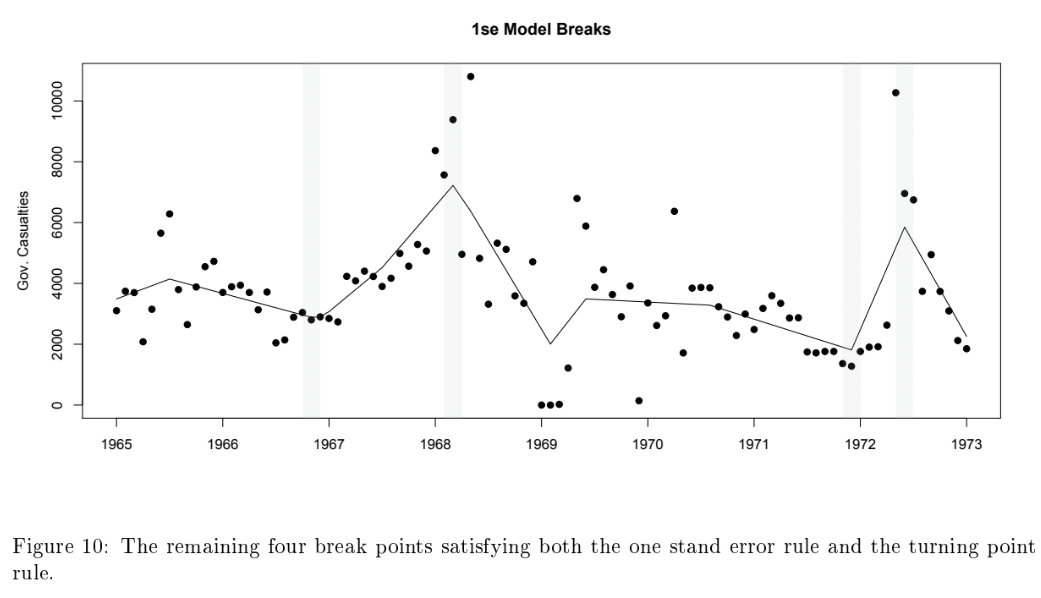
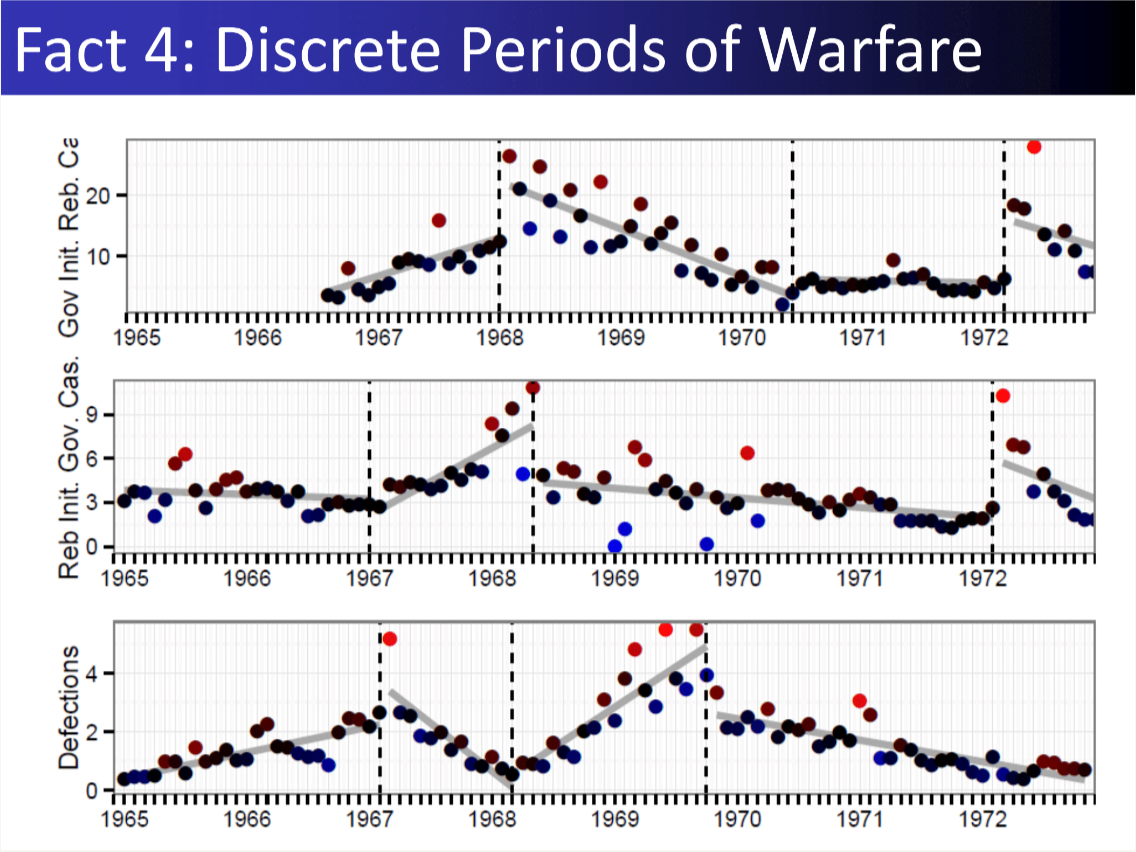
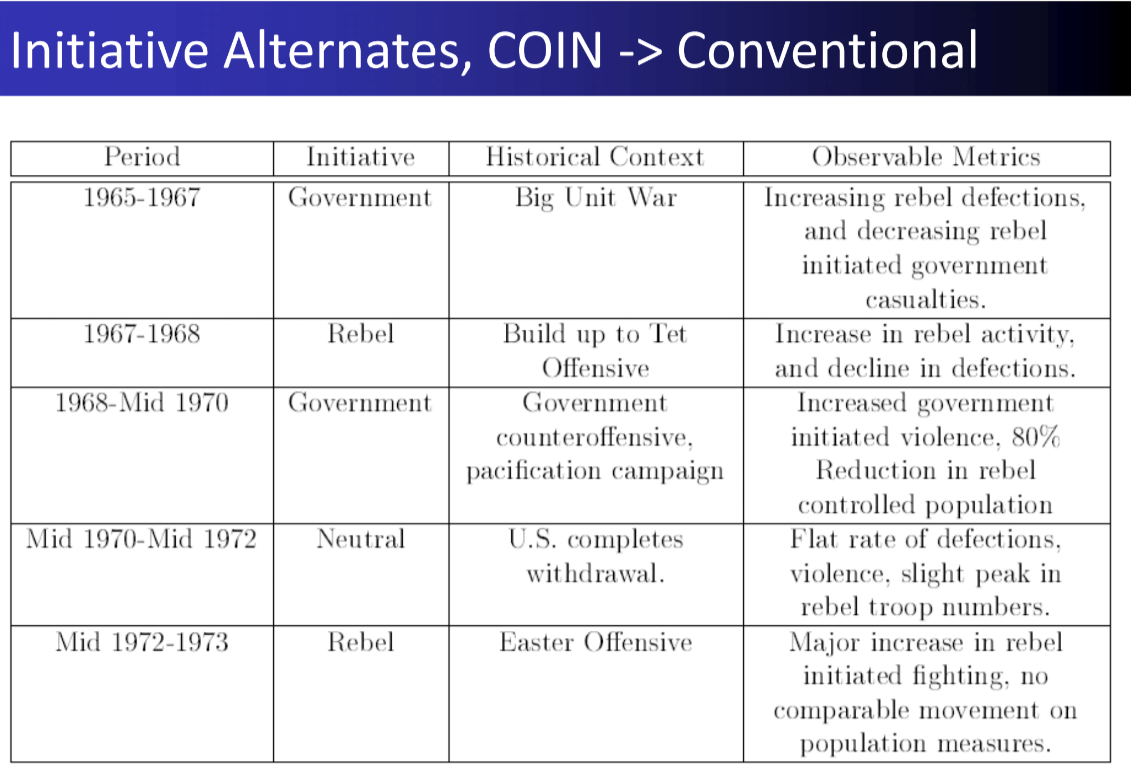
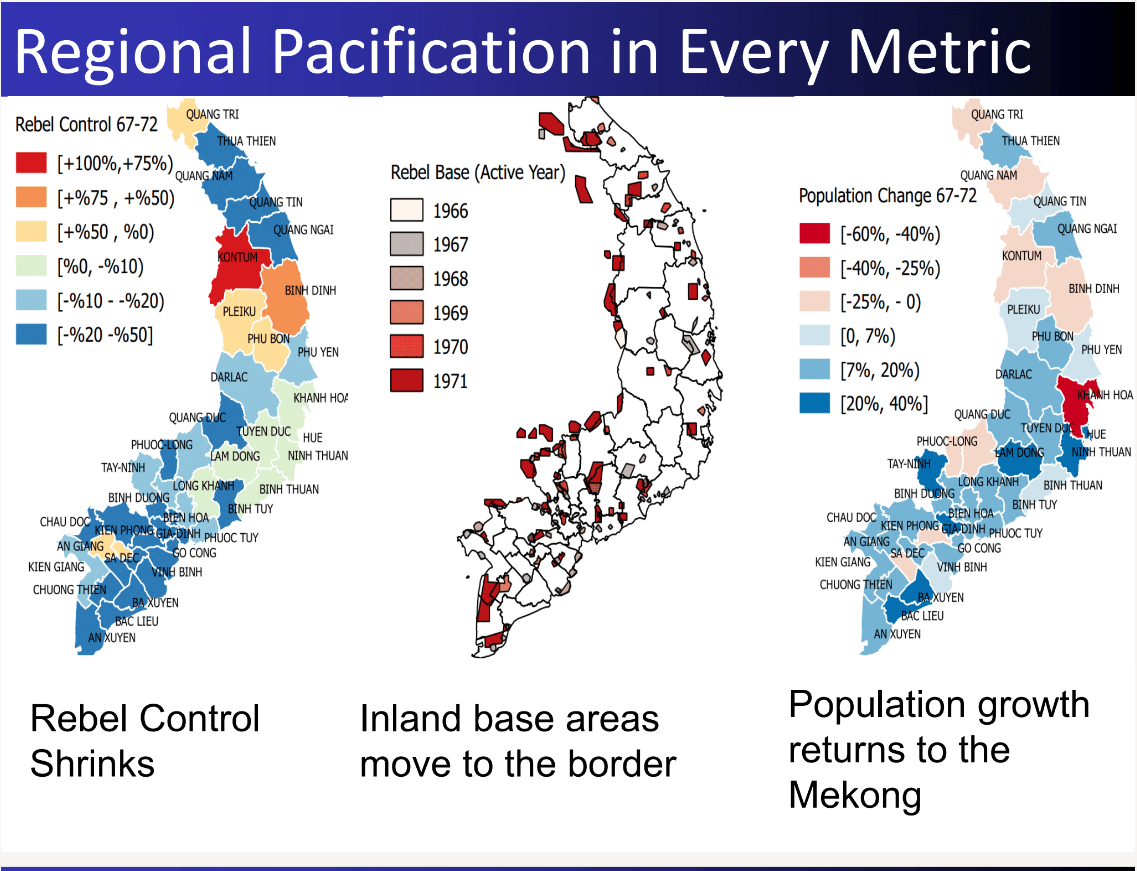
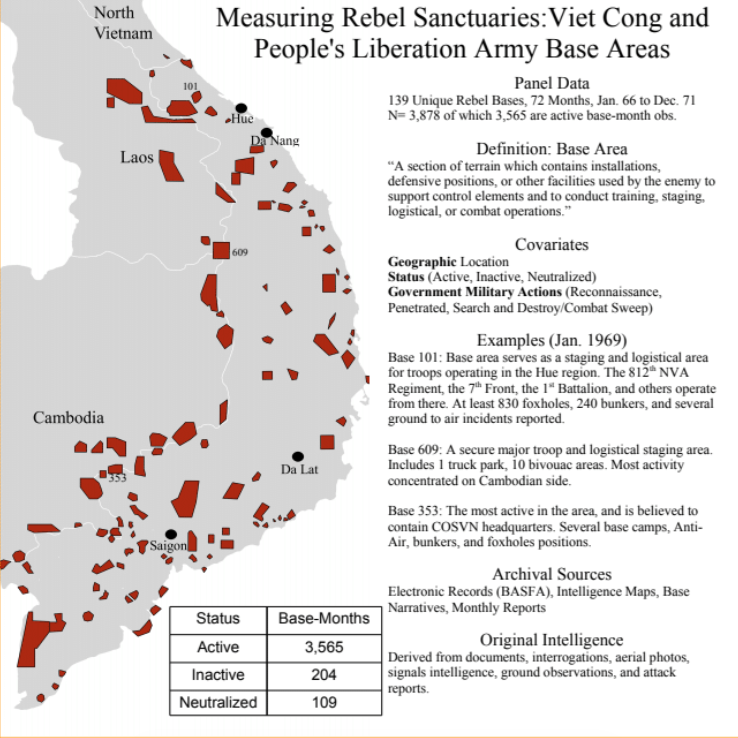
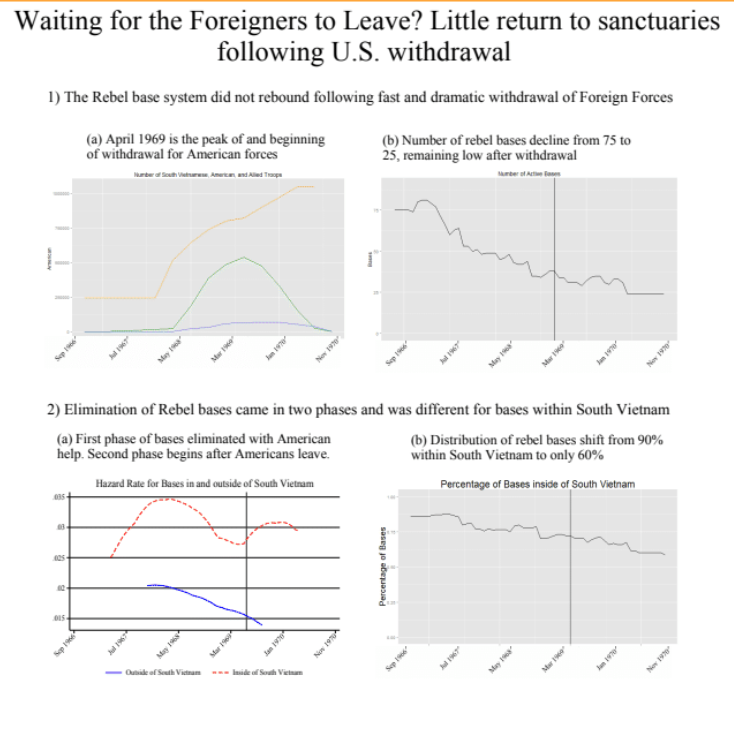
24 Measurement Vietnam War
―Item Response Models―
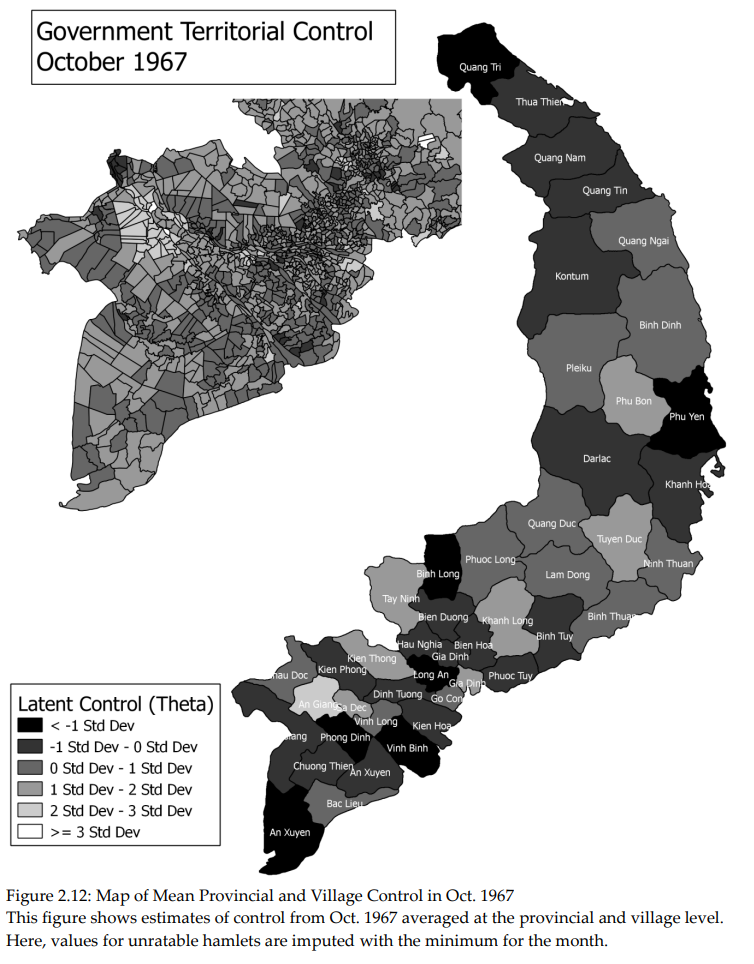
25 Territorial Control in Civil War
“Why Not Divide and Conquer? Targeted Bargaining and Violence in Civil War” Dissertation, 2012, Princeton University, Department of Politics [Ungated Dissertation Print]


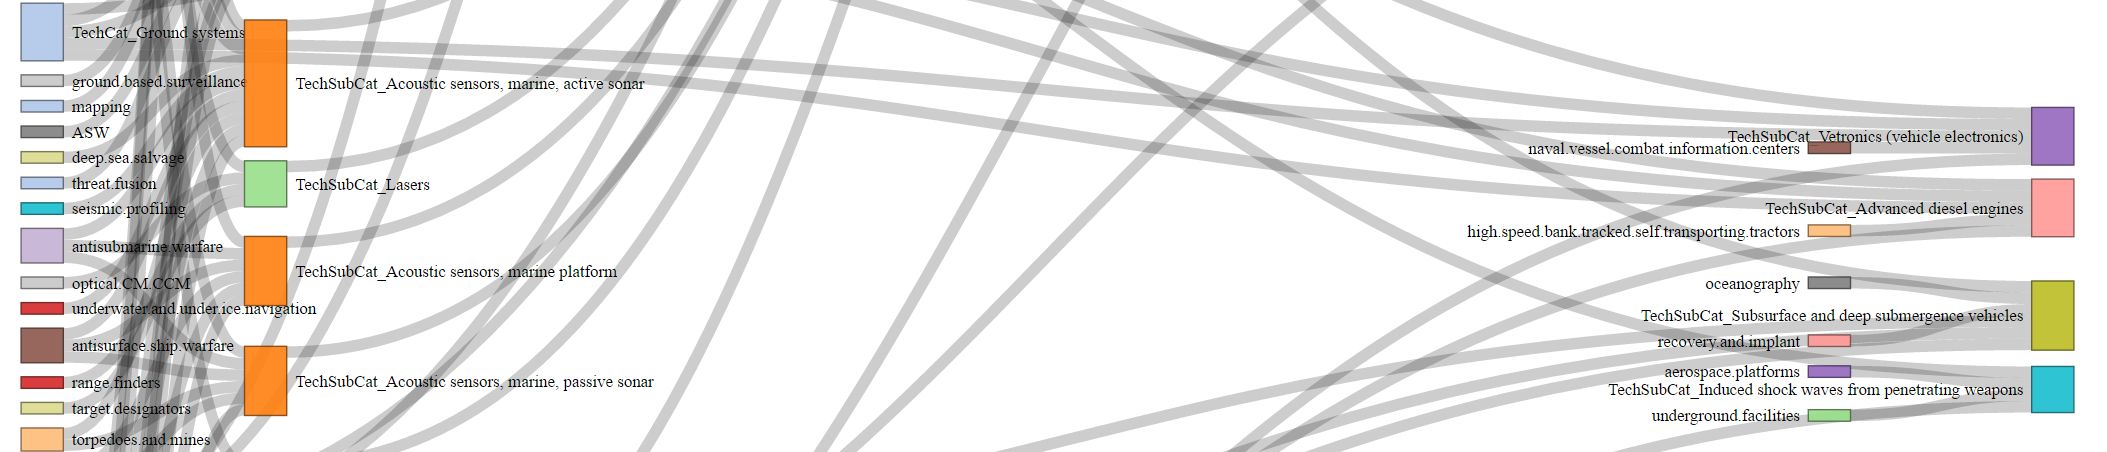
26 Militarily Critical Technologies
―Robotics―
27 Robot for Digitizing Home Photos
[Warning LOUD SOUND]
―Teaching―
I taught a brief course on Machine Learning for new members of my lab and elsewhere by invitation.